Lebanon’s trade deficit declined by 19.07% year-on-year (y-o-y) by August, to record $9.57B due to a 17.75% decrease in overall imports outpacing the 10.78% decline in total exports. The prominent trend of both the depreciating Euro and falling international oil prices are the main factors behind the contractionary trade deficit drift being registered since the start of the year.
Total imports, in the first eight months of the year, amounted to $11.56B compared to $14.06B during the same period last year.
In more details, the three major product categories that were imported to Lebanon by August were mineral products (16.5% share of total imports), “machinery and electrical instruments” (12.1% share of total imports) and “products of the chemical or allied industries” (11.3% share of total imports). The yearly change in the value of imported mineral products displayed a substantial drop of 46.47% from August 2014 to $1.90B.This decline goes hand in hand with the average 45% decrease in the price of international oil since August of last year, noting that demand for this essential commodity is inelastic.
In addition, the value of “machinery and electrical instruments” imported went down by 6.32% y-o-y by August. Worth mentioning that the overall tonnage imported increased from 158,626 tons by August 2014 to 419,321 tons this year. Notably, in the month of April alone, 279,862 tons were brought into Lebanon, as electrical transformers were the bulk of those imports. With that in mind, the 6.32% decline came about from a price fall possibly on the back of deteriorating Chinese prices and the depreciating Euro since China and Europe sell about 40% of electrical appliances to Lebanon.
Total worth of “Products of the chemical or allied industries” entering Lebanon also downturned by an annual 4.99% while volume steadied at a level of 330,000 tons. The latter decline was possibly associated with a decline in the overall price of chemical products.
Notably, the three major countries that Lebanon imported goods from were China, Germany and France with respective weights of 11.89%, 6.94% and 6.06%.
Similarly, total exports fell yearly from $2.23B by August 2014 to $1.99B by August 2015.
Specifically, the value of exported “prepared foodstuffs, beverages, and tobacco” (16.34% share of total exports) experienced a yearly detraction of 4.86% by August despite the 14.28% rise in exported volume to 245,383 tons. It seems that the Lebanese fast moving consumer goods’ (FMCGs) market is following the global bearish price trend of over-the-counter commodities.
Furthermore, exported “pearls, precious stones, and metals”, constituting 14.92% of total exports, went down by 25.56% y-o-y by August. This was mainly due to the 28.57% plunge in the volume exported to 35 tons this year compared to a higher level of 49 tons recorded over the same period last year. In addition, “Machinery and electrical instruments” (14.31% share of total exports) underwent an annual 4.05% shrinkage on the back of the 16.83% fall in tonnage exported to 37,543 tons which was partially offset by a rise in export prices. In terms of the major destinations of the Lebanese exports, Saudi Arabia, United Arab Emirates and Iraq grasped corresponding weights of 12.58%, 10.28% and 7.69%.
In August alone, total exports increased by 26.05% from August 2014 to $219.49M this year. In parallel, overall imports down ticked by 30.24% to $1.48B. In turn, the trade deficit narrowed from $1.82B to $1.26B in August.
Lebanon Imports/Exports by August (in $B)
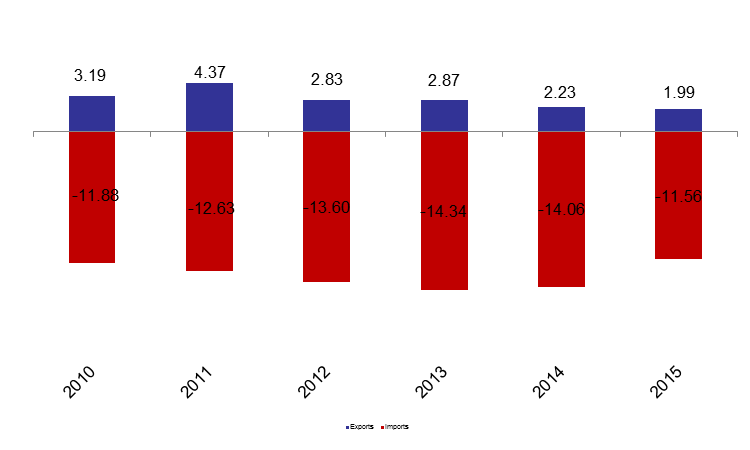
Source: Customs