
According to Kafalat, the number and value of issued guarantees rose from 40 and $5.13M in January 2015 to 54 and $7.93M in January 2016. Accordingly and over the same period, the average loan value per project increased from $128,373 to $146,777.
The geographical allocation in January 2016 showed that the biggest beneficiary of Kafalat guarantees is the region of Mount Lebanon with a share of 40.74%, followed by a 29.63% share for the Bekaa, 16.67% for the North and 7.41% for the South.
Compared to the first month of 2015, 3 additional guarantees were granted in Mount Lebanon, 11 in the Bekaa and 7 in the North, bringing the total number of guarantees to 22, 16 and 9, respectively. However, the number of Kafalat guarantees granted in the South dropped from 8 to 4 over the same period.
In January 2016, the biggest number of Kafalat guarantees was granted to the industrial sector as they accounted for 38.89% of total guarantees followed closely by a 37.04% share for the sector of agriculture, a 16.67% share for the tourism sector and a 5.56% share for the sector of advanced technology.
Compared to January 2015, 8 additional Kafalat guarantees were disbursed for the industrial sector bringing the total number of industrial Kafalat guarantees to 21 in the first month of 2016. The number of Kafalat guarantees for the agricultural sector, the tourism sector and the advanced technology sector also increased from 19, 3 and 2 in 2015 to 20,9 and 3 in 2016, respectively.
Value of Kafalat Guarantees in January, In $
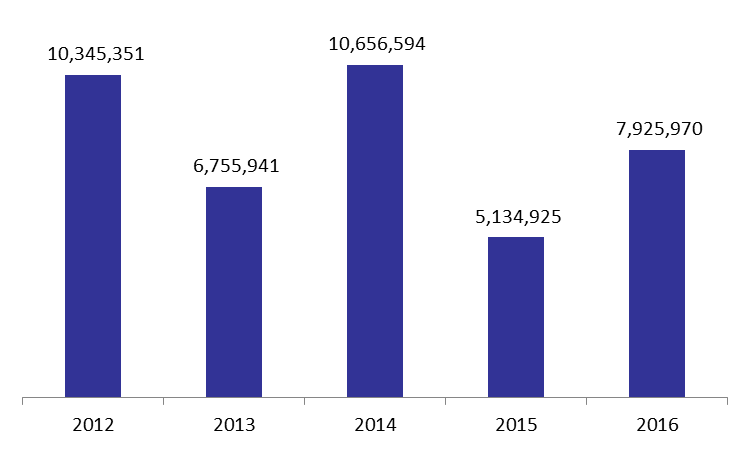
Source: Kafalat