
Discover today’s performance of BLOM indices, the closing prices of Lebanese stocks and Eurobonds, as well as the exchange rate of major currencies against the LBP.
BLOM Stock Index (BSI): Today’s Performance
| Last | Previous | % Change | Y-t-D Change | |
| BSI | 1,146.18 | 1,144.27 | 0.17% | -2.00% |
| High | 1,147.29 | 1,146.90 | ||
| Low | 1,139.52 | 1,143.64 | ||
| Volume | 271,441 | 13,837 | ||
| Val ($) | 1,880,149 | 211,198 |
BLOM Preferred Shares Index (BPSI): Today’s Performance
| Last | Previous | Change | |
| BPSI | 104.05 | 104.04 | 0.01% |
| Volume | 20,900 | 5,346 | |
| Value | 306,075 | 132,483 |
Lebanese Stocks: Today’s Trades and Closing Prices
| Last Price | % Change | Volume | VWAP | |
| Solidere A | $9.39 | 1.19% | 5,949 | $9.36 |
| Solidere B | $9.06 | -1.63% | 39 | $9.06 |
| BLOM Listed | $10.00 | – | – | – |
| BLOM (GDR) | $10.15 | – | 10,000 | $10.15 |
| Audi (C) | $6.09 | 1.50% | 126,062 | $6.10 |
| Audi (GDR) | $6.10 | 1.67% | 105,557 | $6.10 |
| BYBLOS | $1.63 | -2.40% | 2,934 | $1.63 |
| BEMO (C) | $1.75 | – | – | – |
| BoB (C) | $18.80 | – | – | |
| BLC (C) | $1.69 | – | – | – |
| HOLCIM Liban | $14.31 | – | – | – |
| CB (B) | $3.00 | – | – | – |
| CB (N) | $3.10 | – | – | – |
| BLOM Pref 2011 | $10.05 | 0.30% | 19,500 | $10.05 |
| Audi Pref F | $100.20 | – | – | – |
| Audi Pref G | $100.00 | – | – | – |
| Audi Pref H | $100.00 | – | – | – |
| Byblos Pref 08 | $100.20 | – | – | – |
| Byblos Pref 09 | $100.10 | – | ||
| BOB Pref H | $25.25 | – | – | – |
| BoB Pref I | $25.25 | – | – | – |
| BOB Preferred J | $25.25 | – | 400 | $25.25 |
| BoB Priority 2014 | $21.00 | – | – | – |
| BEMO PREF 13 | $100.00 | – | – | – |
| BLC Pref A | $100.50 | – | – | – |
| BLC Pref B | $100.00 | -0.99% | 1,000 | $100.00 |
| BLC Pref C | $101.00 | – | – | – |
| RYMCO | $3.23 | – | – | – |
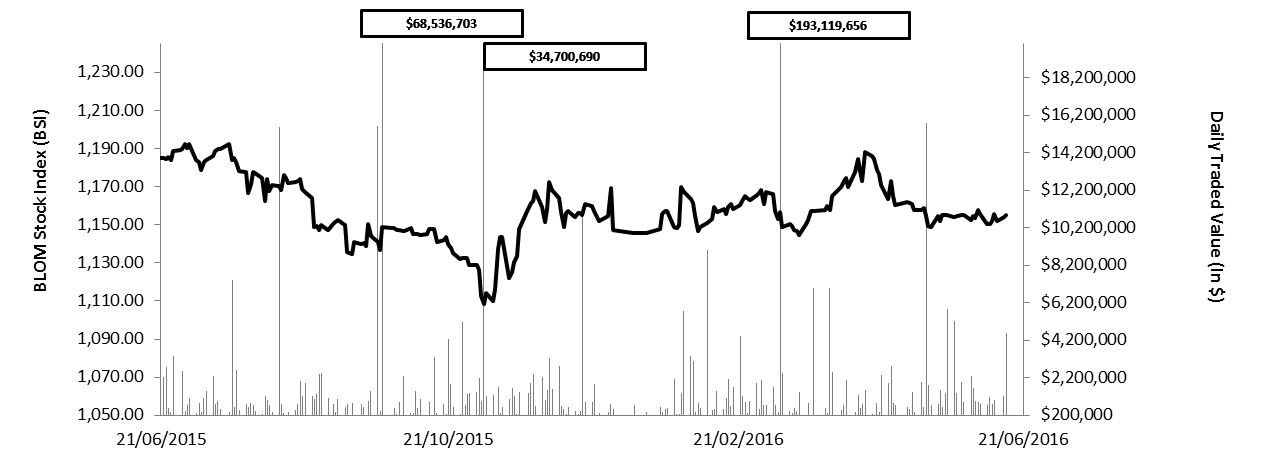
The BLOM Stock Index 52-WEEK TREND
Lebanese Global Depository Receipts: Last session’s Performance
| Last Price ($) | Previous Price ($) | % Change | Volume | Value ($) | |
| BLOM GDR | 10.15 | 10.15 | – | 23,826 | 241,834 |
| Audi GDR | 5.90 | 5.90 | – | – | – |
| Byblos GDR | 75.00 | 75.00 | – | – | – |
| Solidere GDR | 9.10 | 8.90 | 2.25% | 3,053 | 27,782 |
Source: Reuters Closing Date: 20 June 2016
BLOM BOND INDEX: Last Session’s Performance
| Last | Previous | Change | Y-t-D Change | ||
| BBI | 102.88 | 103.65 | -0.75% | -1.18% | |
| Weighted Yield | 6.42% | 6.25% | 17 | bps | |
| Duration (Years) | 5.27 | 5.29 | |||
| 5Y Bond Yield | 6.14% | 6.14% | 0 | bps | |
| 5Y Spread* | 515 | 501 | 14 | bps | |
| 10Y Bond Yield | 6.94% | 6.78% | 16 | bps | |
| 10Y Spread* | 527 | 516 | 11 | bps | |
*between Lebanese Eurobonds and US Treasuries
Closing Date: 20 June 2016
Lebanese Eurobonds: Last Sessions’ Prices and Yields
| Price | Yield | Yield Change (in bps) | |
| Oct. 2017 | 99.38 | 5.49% | 50 |
| Jun. 2018 | 99.25 | 5.55% | 27 |
| Nov. 2018 | 98.88 | 5.65% | 28 |
| Apr. 2019 | 99.25 | 5.79% | 15 |
| May. 2019 | 100.5 | 5.81% | 14 |
| Nov.2019 | 98.5 | 5.94% | 16 |
| Mar. 2020 | 101 | 6.07% | 15 |
| Apr. 2020 | 99 | 6.09% | 15 |
| Apr. 2021 | 108 | 6.29% | 17 |
| Oct. 2022 | 98 | 6.49% | 20 |
| Jan. 2023 | 97.25 | 6.52% | 12 |
| Apr.2024 | 96.5 | 6.80% | 14 |
| Nov. 2024 | 99.25 | 6.77% | 12 |
| Dec. 2024 | 101.25 | 6.80% | 12 |
| Feb. 2025 | 96 | 6.82% | 12 |
| Jun. 2025 | 96 | 6.85% | 14 |
| Nov. 2026 | 97.25 | 6.97% | 17 |
| Nov. 2027 | 98.25 | 6.97% | 13 |
| Nov. 2028 | 97.35 | 6.97% | 13 |
| Feb. 2030 | 96.5 | 7.05% | 10 |
| Apr. 2031 | 99.5 | 7.05% | 4 |
| Nov. 2035 | 98.5 | 7.19% | 9 |
| Last Price | Previous | % Change | Y-t-D | |
| $/LBP | 1,514.00 | 1,514.00 | – | |
| €/LBP | 1,710.41 | 1,708.60 | 0.11% | |
| £/LBP | 2,220.40 | 2,203.66 | 0.76% | |
| NEER | 165.72 | 165.82 | -0.06% | -1.58% |
Date: 21 June 2016