
Discover today’s performance of BLOM indices, the closing prices of Lebanese stocks and Eurobonds, as well as the exchange rate of major currencies against the LBP.
BLOM Stock Index (BSI): Today’s Performance
| Last | Previous | % Change | Y-t-D Change | |
| BSI | 1,155.19 | 1,158.87 | -0.32% | -1.23% |
| High | 1,158.49 | 1,162.04 | ||
| Low | 1,151.75 | 1,157.04 | ||
| Volume | 40,057 | 1,374,677 | -97.09% | |
| Val ($) | 666,876 | 5,006,444 | -86.68% |
BLOM Preferred Shares Index (BPSI): Today’s Performance
| Last | Previous | Change | |
| BPSI | 104.26 | 104.28 | -0.02% |
| Volume | 3,258 | 21,962 | |
| Value | 259,265 | 699,065 |
Lebanese Stocks: Today’s Trades and Closing Prices
| Active Stocks | Volume | Value | Closing Price ($) | % change |
| Solidere A | 6,062 | 57,897 | 9.47 | -1.66% |
| Solidere B | 3,009 | 29,247 | 9.72 | 0.00% |
| Bank Audi | 478 | 2,964 | 6.2 | -0.80% |
| Bank Audi Pref. Class G | 476 | 47,600 | 100 | 0.00% |
| Bank of Beirut – Listed shares | 5,000 | 94,000 | 18.8 | 0.00% |
| Bank of Beirut Pref. Class J | 900 | 22,950 | 25.5 | 0.00% |
| Byblos Bank Pref. Class 2008 | 1,855 | 186,012 | 100.3 | 0.00% |
| Byblos Bank Pref. Class 2009 | 27 | 2,703 | 100.1 | -0.09% |
| BLOM Bank GDR | 22,250 | 223,503 | 10.05 | 0.00% |
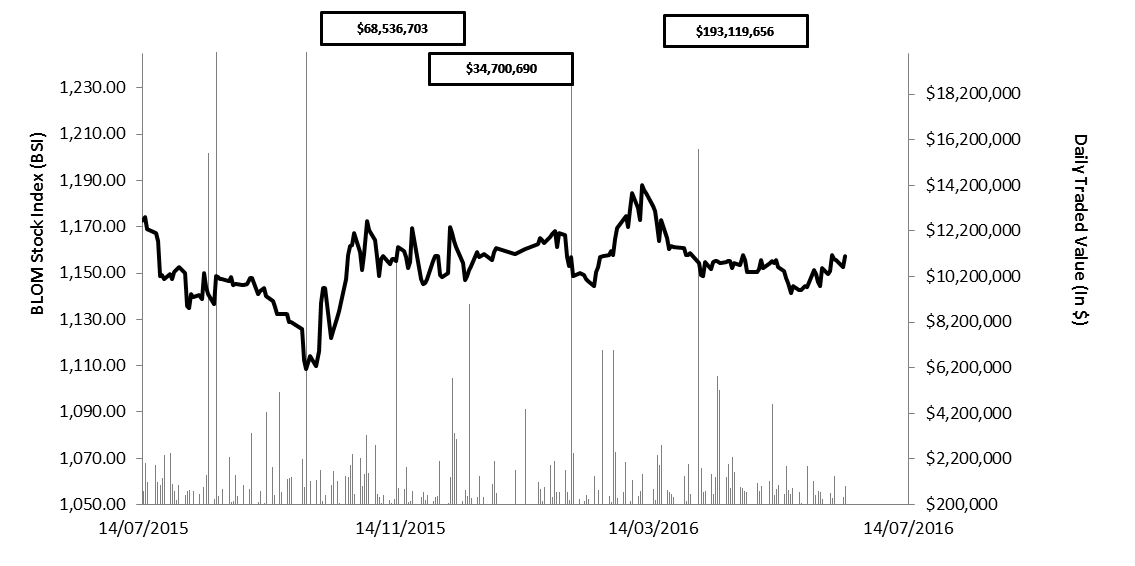
The BLOM Stock Index 52-WEEK TREND
Lebanese Global Depository Receipts: Last session’s Performance
| GDRs | Last Price ($) | Previous Price ($) | % Change | Volume | Value ($) |
| BLOM GDR | 10.05 | 10.05 | – | 10,000 | 100,500 |
| Audi GDR | 6.20 | 6.20 | – | – | – |
| Byblos GDR | 75.00 | 75.00 | – | – | – |
| Solidere GDR | 9.70 | 9.54 | 1.68% | 7,514 | 72,886 |
Source: Reuters Closing Date: 13 July 2016
BLOM BOND INDEX: Last Session’s Performance
| Last | Previous | Change | Y-t-D Change | ||
| BBI | 103.15 | 103.14 | 0.01% | -0.92% | |
| Weighted Yield | 6.34% | 6.35% | 0 | bps | |
| Duration (Years) | 5.21 | 5.21 | |||
| 5Y Bond Yield | 6.24% | 6.25% | -1 | bps | |
| 5Y Spread* | 517 | 514.9 | 2.1 | bps | |
| 10Y Bond Yield | 6.88% | 6.95% | -7 | bps | |
| 10Y Spread* | 540 | 542 | -2 | bps | |
*between Lebanese Eurobonds and US Treasuries
Closing Date: 13 July 2016
Lebanese Eurobonds: Last Sessions’ Prices and Yields
| Price | Yield | Yield Change (in bps) | |
| Oct. 2017 | 99.63 | 5.30% | 0.07 |
| Jun. 2018 | 99.63 | 5.35% | 0.02 |
| Nov. 2018 | 99.38 | 5.43% | 0.03 |
| Apr. 2019 | 99.38 | 5.74% | 0.02 |
| May. 2019 | 100.63 | 5.75% | -0.03 |
| Nov.2019 | 99 | 5.78% | -3.97 |
| Mar. 2020 | 101.38 | 5.95% | -0.03 |
| Apr. 2020 | 99.38 | 5.98% | 0.01 |
| Apr. 2021 | 108.25 | 6.21% | -0.01 |
| Oct. 2022 | 98.25 | 6.44% | -0.10 |
| Jan. 2023 | 97.38 | 6.50% | 0.01 |
| Apr.2024 | 96.88 | 6.74% | 0.02 |
| Nov. 2024 | 99.75 | 6.69% | 0.01 |
| Dec. 2024 | 101.5 | 6.76% | 0.00 |
| Feb. 2025 | 96.25 | 6.78% | -0.01 |
| Jun. 2025 | 96.25 | 6.82% | 0.02 |
| Nov. 2026 | 97.75 | 6.91% | 0.01 |
| Nov. 2027 | 98.38 | 6.96% | 0.00 |
| Nov. 2028 | 97.25 | 6.99% | 0.00 |
| Feb. 2030 | 96.5 | 7.05% | 0.00 |
| Apr. 2031 | 99 | 7.11% | 0.01 |
| Nov. 2035 | 98.25 | 7.22% | 0.00 |
| Last Price | Previous | % Change | Y-t-D | |
| $/LBP | 1,514.00 | 1,514.00 | – | |
| €/LBP | 1,681.31 | 1,662.32 | 1.14% | |
| £/LBP | 2,013.12 | 1,947.99 | 3.34% | |
| NEER | 166.45 | 166.93 | -0.29% | -1.15% |
Closing Date: 15 July