Discover today’s performance of BLOM indices, the closing prices of Lebanese stocks and Eurobonds, as well as the exchange rate of major currencies against the LBP.
BLOM Stock Index (BSI): Today’s Performance
| Last | Previous | % Change | Y-t-D Change | |
| BSI | 1,162.02 | 1,163.61 | -0.14% | -0.64% |
| High | 1,163.63 | 1,167.03 | ||
| Low | 1,162.01 | 1,156.67 | ||
| Volume | 13,772 | 50,349 | -72.65% | |
| Val ($) | 118,059 | 425,153 | -72.23% |
BLOM Preferred Shares Index (BPSI): Today’s Performance
| Last | Previous | Change | |
| BPSI | 104.81 | 104.81 | 0.00% |
| Volume | 0 | 0 | |
| Value | 0 | 0 |
Lebanese Stocks: Today’s Trades and Closing Prices
| Last Price ($) | % Change | Volume | VWAP ($) | |
| Solidere A | 9.69 | 1.36% | 5,740 | 9.67 |
| Solidere B | 9.63 | -1.33% | 5,632 | 9.53 |
| HOLCIM Liban | 14.17 | -2.28% | 400 | 14.17 |
| BYBLOS | 1.61 | -1.23% | 2,000 | 1.61 |
| BLOM (GDR) | 10.30 | – | – | – |
| Audi (C) | 6.20 | – | – | – |
| Audi (GDR) | 6.21 | – | – | – |
| Audi Pref F | 100.50 | – | – | – |
| Audi Pref G | 101.80 | – | – | – |
| Audi Pref H | 101.00 | – | – | – |
| BEMO (C) | 1.72 | – | – | – |
| BEMO PREF 13 | 100.00 | – | – | – |
| BLC (C) | 2.77 | – | – | – |
| BLC Pref B | 100.00 | – | – | – |
| BLC Pref C | 100.00 | – | – | – |
| BLOM Listed | 10.10 | – | – | – |
| BLOM Pref 2011 | 10.00 | – | – | – |
| BoB (C) | 18.80 | – | – | – |
| BOB Pref H | 25.00 | – | – | – |
| BoB Pref I | 26.00 | – | – | – |
| BOB Preferred J | 26.00 | – | – | – |
| BOB Preferred K | 25.00 | – | – | – |
| BoB Priority 2014 | 21.00 | – | – | – |
| Byblos Pref 08 | 101.00 | – | – | – |
| Byblos Pref 09 | 101.10 | – | – | – |
| CB (B) | 2.70 | – | – | – |
| CB (N) | 3.10 | – | – | – |
| RYMCO | 3.25 | – | – | – |
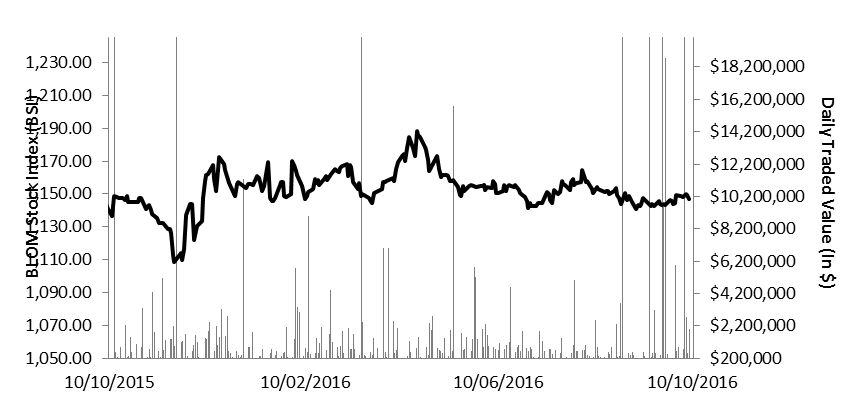
The BLOM Stock Index 52-WEEK TREND
Lebanese Global Depository Receipts: Last session’s Performance
| GDRs | Last Price ($) | Previous Price ($) | % Change | Volume | Value ($) |
| BLOM GDR | 10.30 | 10.30 | – | 215,100 | 2,215,530 |
| Audi GDR | 6.25 | 6.25 | – | – | – |
| Byblos GDR | 80.00 | 80.00 | – | – | – |
| Solidere GDR | 9.75 | 9.50 | 2.63% | 6,620 | 64,545 |
Source: Reuters, Closing Date: 7 October 2016
BLOM BOND INDEX: Last Session’s Performance
| Last | Previous | Change | Y-t-D Change | ||
| BBI | 103.21 | 103.21 | 0.00% | –0.87% | |
| Weighted Yield | 6.40% | 6.40% | 0 | bps | |
| Duration (Years) | 5.04 | 5.04 | |||
| 5Y Bond Yield | 6.23% | 6.22% | 1 | bps | |
| 5Y Spread* | 497 | 494 | 3 | bps | |
| 10Y Bond Yield | 6.81% | 6.81% | 0 | bps | |
| 10Y Spread* | 508 | 506 | 2 | bps | |
*between Lebanese Eurobonds and US Treasuries
Closing Date: 7 October 2016
Lebanese Eurobonds: Last Sessions’ Prices and Yields
| Price | Yield | Yield Change (in bps) | |
| Oct. 2017 | 99.25 | 5.77% | 0 |
| Jun. 2018 | 99 | 5.78% | 0 |
| Nov. 2018 | 98.75 | 5.79% | 0 |
| Apr. 2019 | 99.13 | 5.87% | 0 |
| May. 2019 | 99.5 | 6.21% | 0 |
| Nov.2019 | 98.63 | 5.93% | 0 |
| Mar. 2020 | 100.88 | 6.08% | 0 |
| Apr. 2020 | 99.13 | 6.08% | 0 |
| Apr. 2021 | 108 | 6.19% | 0 |
| Oct. 2022 | 98.63 | 6.38% | 0 |
| Jan. 2023 | 97.75 | 6.44% | 0 |
| Apr.2024 | 97.13 | 6.72% | 0 |
| Nov. 2024 | 99.75 | 6.69% | 0 |
| Dec. 2024 | 101.75 | 6.72% | 0 |
| Feb. 2025 | 96.63 | 6.73% | 0 |
| Jun. 2025 | 96.63 | 6.77% | 0 |
| Nov. 2026 | 98.38 | 6.82% | 0 |
| Nov. 2027 | 99 | 6.88% | 0 |
| Nov. 2028 | 97.75 | 6.93% | 0 |
| Feb. 2030 | 97.25 | 6.97% | 0 |
| Apr. 2031 | 99.63 | 7.04% | 0 |
| Nov. 2035 | 99.25 | 7.12% | 0 |
| Last Price | Previous | % Change | Y-t-D | |
| $/LBP | 1,514.25 | 1,514.25 | – | |
| €/LBP | 1,683.27 | 1,688.25 | -0.29% | |
| £/LBP | 1,869.90 | 1,874.12 | -0.23% | |
| NEER | 264.11 | 264.25 | -0.05% | 56.85% |
Closing Date: 10 October