
Discover today’s performance of BLOM indices, the closing prices of Lebanese stocks and Eurobonds, as well as the exchange rate of major currencies against the LBP.
BLOM Stock Index (BSI): Today’s Performance
| Last | Previous | %Change | Y-t-D Change | |
| BSI | 1,224.62 | 1,231.11 | -0.53% | 4.71% |
| High | 1,228.97 | 1,234.13 | ||
| Low | 1,219.39 | 1,223.21 | ||
| Volume | 179,793 | 368,180 | -51.17% | |
| Val ($) | 1,005,371 | 1,163,138 | -13.56% |
BLOM Preferred Shares Index (BPSI): Today’s Performance
| Last | Previous | Change | |
| BPSI | 105.58 | 105.58 | 0.00% |
| Volume | – | 63 | |
| Value | – | 6,583 |
Lebanese Stocks: Today’s Trades and Closing Prices
| Last Price ($) | % Change | Volume | VWAP ($) | |
| Solidere A | 11.01 | -1.96% | 32,327 | 11.04 |
| Solidere B | 11.14 | -0.86% | 2,432 | 11.18 |
| Audi GDR | 6.75 | -2.17% | 50,000 | 6.75 |
| Byblos Listed | 1.67 | -1.76% | 81,334 | 1.66 |
| BLOM Listed | 10.36 | 0.10% | 5,000 | 10.36 |
| BLOM GDR | 11.10 | 0.91% | 8,700 | 11.10 |
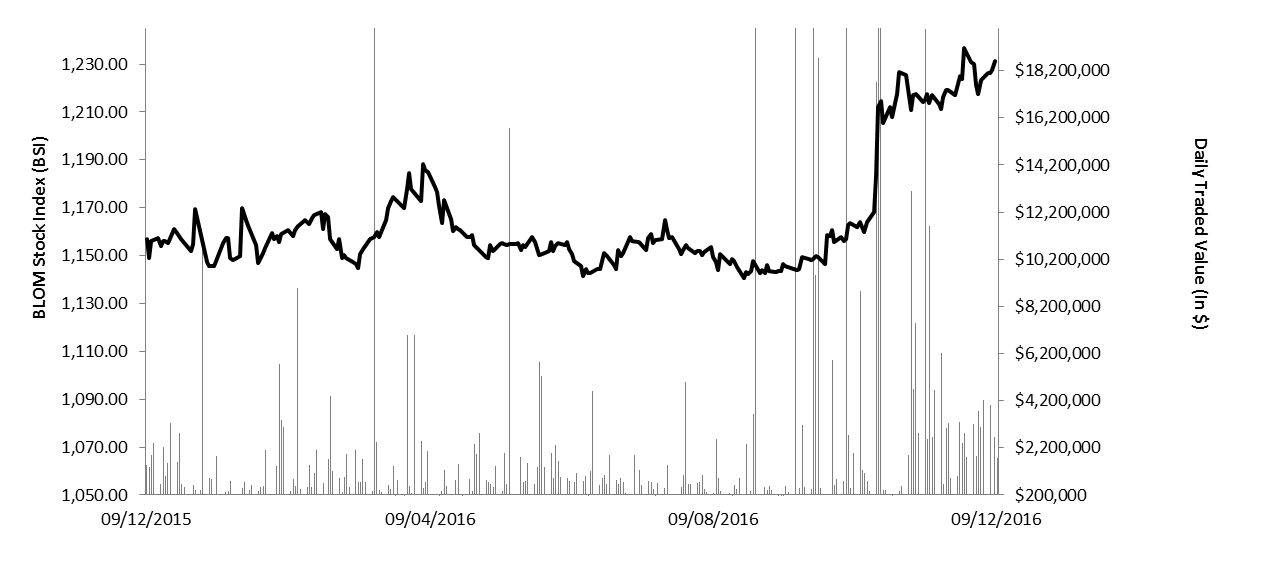
The BLOM Stock Index 52-WEEK TREND
Lebanese Global Depository Receipts: Last session’s Performance
| GDRs | Last Price ($) | Previous Price ($) | % Change | Volume | Value ($) |
| BLOM GDR | 10.95 | 10.85 | 0.92% | 3,911 | 42,825 |
| Audi GDR | 6.75 | 6.50 | 3.85% | 1,000 | 6,750 |
| Byblos GDR | 79.00 | 79.00 | – | – | – |
| Solidere GDR | 11.10 | 10.50 | 5.71% | 3,547 | 39,372 |
Source: Reuters
Closing Date: 8 December 2016
BLOM BOND INDEX: Last Session’s Performance
| Last | Previous | Change | Y-t-D Change | ||
| BBI | 100.02 | 99.94 | 0.07% | -3.93% | |
| Weighted Yield | 7.03% | 7.02% | 1 | bps | |
| Duration (Years) | 5.08 | 5.08 | |||
| 5Y Bond Yield | 6.94% | 6.90% | 4 | bps | |
| 5Y Spread* | 511 | 510 | 1 | bps | |
| 10Y Bond Yield | 7.54% | 7.54% | 0 | bps | |
| 10Y Spread* | 514 | 520 | -6 | bps | |
*between Lebanese Eurobonds and US Treasuries
Closing Date: 8 December 2016
Lebanese Eurobonds: Last Sessions’ Prices and Yields
| day/month/year | Price | Yield | Yield Change(in bps) |
| 12/06/2018 | 98.80 | 5.99% | 0 |
| 12/11/2018 | 98.38 | 6.05% | 0 |
| 23/04/2019 | 98.38 | 6.24% | 0 |
| 20/05/2019 | 99.25 | 6.33% | 6 |
| 28/11/2019 | 97.25 | 6.48% | 15 |
| 09/03/2020 | 99.13 | 6.67% | 4 |
| 14/04/2020 | 97.25 | 6.73% | 9 |
| 19/06/2020 | 98.10 | 6.76% | 8 |
| 12/04/2021 | 105.00 | 6.89% | 3 |
| 04/10/2022 | 95.38 | 7.08% | 0 |
| 27/01/2023 | 94.50 | 7.12% | 0 |
| 22/04/2024 | 96.38 | 7.29% | -2 |
| 04/11/2024 | 93.38 | 7.37% | 0 |
| 03/12/2024 | 97.75 | 7.38% | 0 |
| 26/02/2025 | 92.50 | 7.43% | 0 |
| 12/06/2025 | 92.38 | 7.48% | 0 |
| 28/11/2026 | 93.50 | 7.54% | -4 |
| 29/11/2027 | 94.00 | 7.56% | -5 |
| 03/11/2028 | 92.70 | 7.59% | -6 |
| 26/02/2030 | 91.50 | 7.68% | -6 |
| 22/04/2031 | 93.88 | 7.71% | -6 |
| 02/11/2035 | 93.88 | 7.67% | -16 |
| Last Price | Previous | % Change | Y-t-D | |
| $/LBP | 1,514.25 | 1,514.25 | – | |
| €/LBP | 1,591.62 | 1,600.21 | -0.54% | |
| £/LBP | 1,898.24 | 1,897.04 | 0.06% | |
| NEER | 118.01 | 117.53 | 0.41% | 7.88% |
Closing Date: 9 December