
Discover today’s performance of BLOM indices, the closing prices of Lebanese stocks and Eurobonds, as well as the exchange rate of major currencies against the LBP.
BLOM Stock Index (BSI): Today’s Performance BLOM Preferred Shares Index (BPSI): Today’s Performance Lebanese Stocks: Today’s Trades and Closing Prices Lebanese Global Depository Receipts: Last session’s Performance Source: Reuters Closing Date: 12 January 2017 BLOM BOND INDEX: Last Session’s Performance *between Lebanese Eurobonds and US Treasuries Closing Date: 12 January 2017 Lebanese Eurobonds: Last Sessions’ Prices and Yields Closing Date: 13 January 2017 Last Previous %Change Y-t-D Change BSI 1,207.03 1,215.95 -0.73% -0.47% High 1,215.02 1,219.29 Low 1,204.64 1,209.67 Volume 86,606 224,648 -61.45% Val ($) 849,262 2,417,066 -64.86% Last Previous Change BPSI 105.40 105.39 0.01% Volume 16,960 – Value 217,296 – Last Price ($) % Change Volume VWAP ($) Solidere A 10.13 -0.49% 20,495 10.08 Solidere B 9.97 -2.06% 1,325 9.97 Audi GDR 6.55 -4.80% 25,637 6.55 Byblos Preferred 2008 102.10 0.10% 500 102.10 BLOM GDR 11.07 -2.04% 22,000 11.07 BLOM Pref 2011 10.10 0.00% 16,460 10.10 Ciment Blanc (Bearer) 3.25 0.00% 189 3.25
The BLOM Stock Index 52-WEEK TREND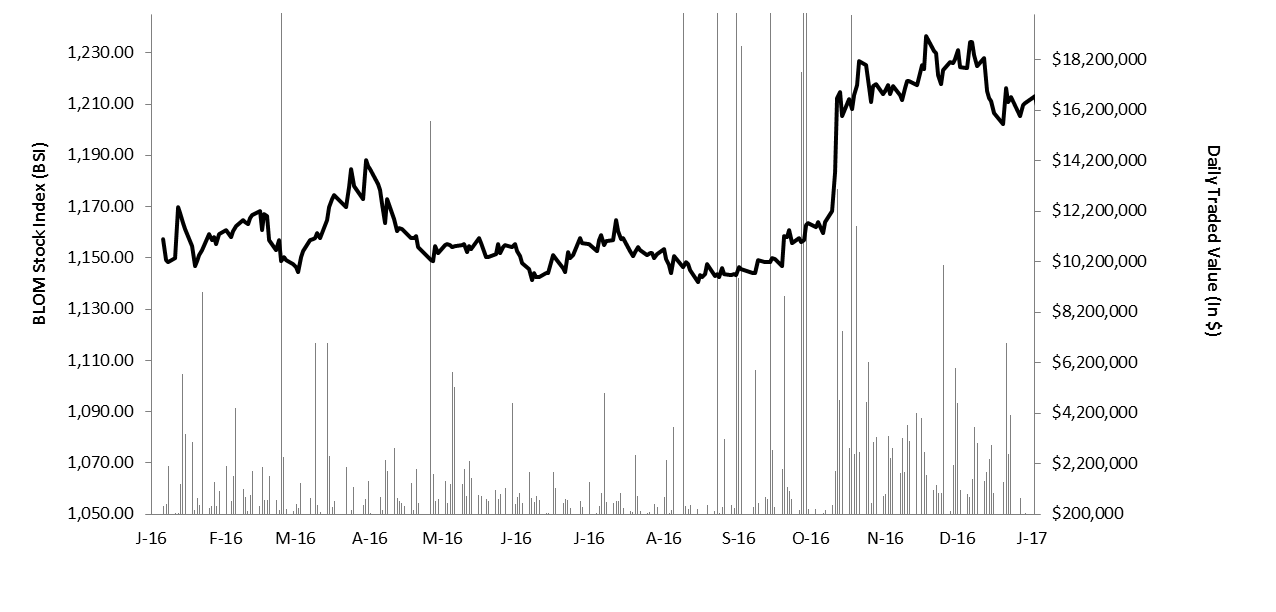
GDRs Last Price ($) Previous Price ($) % Change Volume Value ($) BLOM GDR 11.20 11.00 1.82% 3,958 44,330 Audi GDR 6.70 6.80 -1.47% 23,719 158,917 Byblos GDR 79.00 79.00 – – – Solidere GDR 9.90 9.75 1.54% 3,000 29,700 Last Previous Change Y-t-D Change BBI 103.77 103.80 -0.02% 1.84% Weighted Yield 6.24% 6.24% 0 bps Duration (Years) 5.04 5.04 5Y Bond Yield 6.18% 6.18% 0 bps 5Y Spread* 431 429 2 bps 10Y Bond Yield 6.83% 6.83% 0 bps 10Y Spread* 447 445 2 bps Price Yield Yield Change 12/06/2018 100.00 5.15% 0 12/11/2018 100.00 5.15% 0 23/04/2019 100.00 5.50% 0 20/05/2019 101.00 5.54% 0 28/11/2019 99.50 5.64% 0 09/03/2020 101.75 5.76% -4 14/04/2020 99.75 5.88% 4 19/06/2020 100.75 5.90% 4 12/04/2021 108.30 6.00% 2 04/10/2022 99.05 6.30% -1 27/01/2023 98.35 6.33% -2 22/04/2024 100.50 6.56% 0 04/11/2024 97.88 6.60% 0 03/12/2024 102.35 6.61% 0 26/02/2025 97.00 6.68% -4 12/06/2025 97.00 6.72% -4 28/11/2026 98.25 6.85% 0 29/11/2027 98.88 6.90% 2 03/11/2028 97.75 6.93% 2 26/02/2030 97.25 6.97% 3 22/04/2031 99.50 7.05% 6 02/11/2035 99.25 7.12% 2 Last Price Previous % Change Y-t-D $/LBP 1,514.00 1,514.00 – €/LBP 1,602.77 1,605.19 -0.15% £/LBP 1,835.98 1,851.51 -0.84% NEER 118.40 118.16 0.14% 0.46%