
Discover today’s performance of BLOM indices, the closing prices of Lebanese stocks and Eurobonds, as well as the exchange rate of major currencies against the LBP.
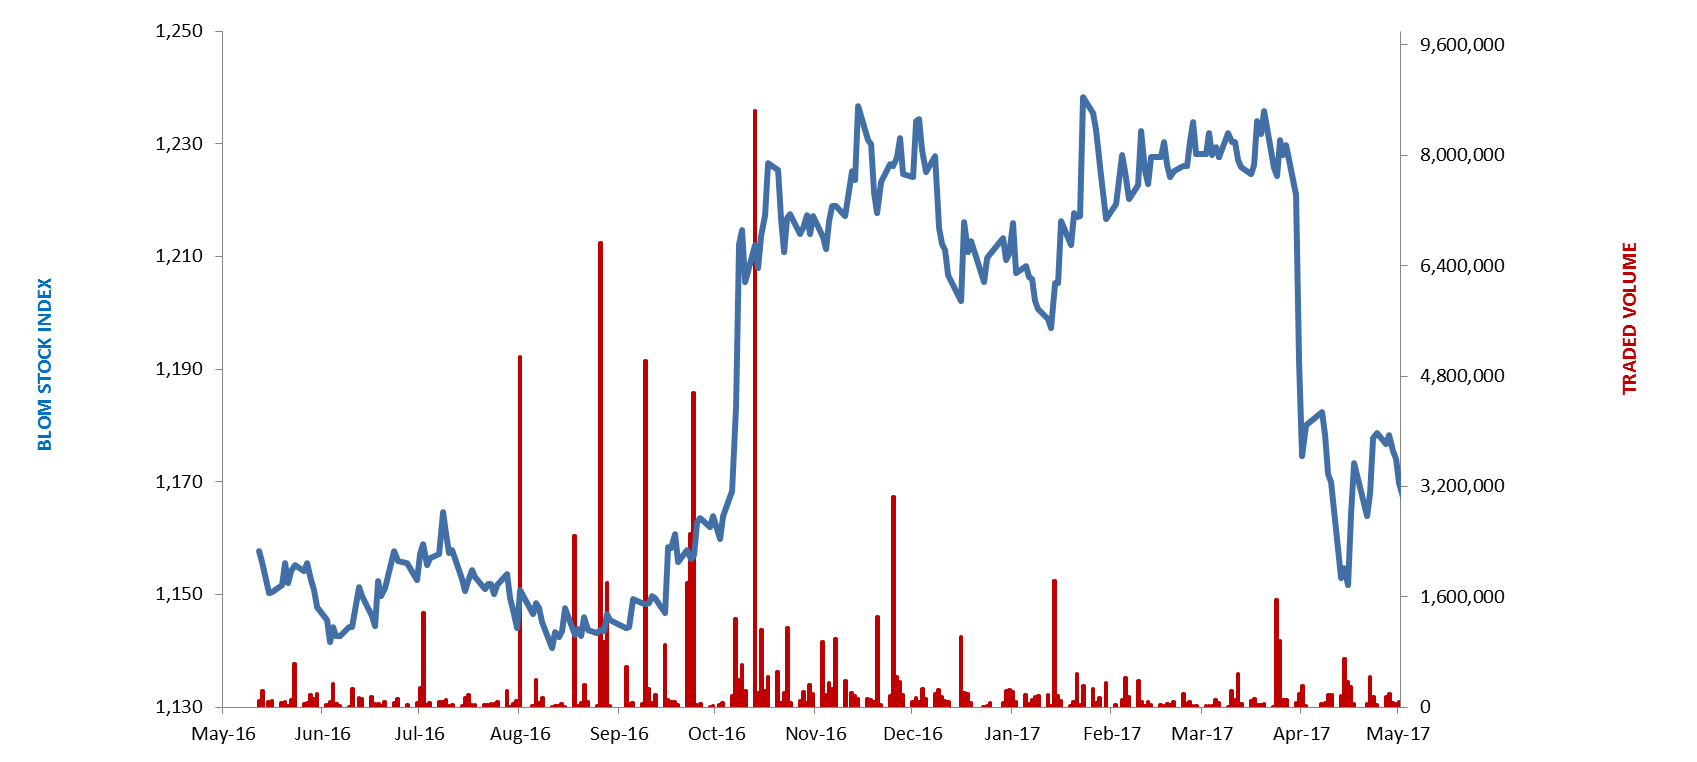
BLOM Stock Index (BSI): Today’s Performance
| Last | Previous | % Change | Y-t-D Change | |
| BSI | 1,155.86 | 1,156.36 | -0.04% | -4.69% |
| High | 1,158.52 | 1,156.36 | ||
| Low | 1,151.23 | 1,150.78 | ||
| Volume | 127,929 | 375,877 | -65.97% | |
| Val ($) | 1,249,326 | 3,969,683 | -68.53% |
BLOM Preferred Shares Index (BPSI): Today’s Performance
| Last | Previous | Change | |
| BPSI | 104.95 | 104.95 | 0.00% |
| Volume | 200 | 1,250 | |
| Value | 125,000 | 127,500 |
Lebanese Stocks: Today’s Trades and Closing Prices
| Last Price ($) | % Change | Volume | VWAP ($) | |
| Solidere A | 8.95 | 0.34% | 8,380 | 8.81 |
| Solidere B | 8.69 | -3.23% | 2,017 | 8.68 |
| BLC Bank Preferred D | 100.00 | – | 200 | 100.00 |
| Bank Audi Listed | 6.01 | -1.48% | 44,860 | 6.01 |
| Bank Audi GDR | 6.10 | – | 500 | 6.10 |
| BoB Priority 2014 | 21.00 | – | 5,000 | 21.00 |
| Byblos Bank Listed | 1.61 | 2.55% | 250 | 1.61 |
| BLOM Bank Listed | 10.80 | 0.93% | 27,056 | 10.80 |
| BLOM Bank GDR | 11.80 | – | 39,666 | 11.80 |
The BLOM Stock Index
Lebanese Global Depository Receipts: Last session’s Performance
| GDRs | Last Price ($) | Previous Price ($) | % Change | Volume | Value ($) |
| BLOM GDR | 11.80 | 11.80 | – | – | – |
| Audi GDR | 6.10 | 6.10 | – | – | – |
| Byblos GDR | 82.00 | 82.00 | – | – | – |
| Solidere GDR | 8.82 | 8.61 | 2.44% | 456 | 4,022 |
Source: Reuters
Closing Date: 25 May 2017
BLOM BOND INDEX: Last Session’s Performance
| Last | Previous | Change | Y-t-D Change | ||
| BBI | 105.26 | 105.18 | 0.08% | 3.30% | |
| Weighted Yield | 6.058% | 6.067% | -0.94 | bps | |
| Duration (Years) | 5.31 | 5.32 | |||
| 5Y Bond Yield | 5.80% | 5.81% | -1 | bps | |
| 5Y Spread* | 402 | 397 | 5 | bps | |
| 10Y Bond Yield | 6.71% | 6.73% | -2 | bps | |
| 10Y Spread* | 446 | 444 | 2 | bps | |
*between Lebanese Eurobonds and US Treasuries
Closing Date: 25 May 2017
Lebanese Eurobonds: Last Sessions’ Prices and Yields
| Price | Yield | Yield Change | |
| 12/06/2018 | 100.50 | 4.65% | -12 |
| 12/11/2018 | 100.63 | 4.70% | 8 |
| 23/04/2019 | 100.70 | 5.11% | 3 |
| 20/05/2019 | 101.63 | 5.13% | 0 |
| 28/11/2019 | 100.38 | 5.29% | 5 |
| 09/03/2020 | 102.25 | 5.49% | 0 |
| 14/04/2020 | 100.63 | 5.56% | 0 |
| 19/06/2020 | 101.50 | 5.61% | 0 |
| 12/04/2021 | 108.63 | 5.73% | -4 |
| 04/10/2022 | 101.25 | 5.82% | 0 |
| 27/01/2023 | 100.63 | 5.87% | 0 |
| 22/04/2024 | 102.38 | 6.22% | -2 |
| 04/11/2024 | 99.75 | 6.29% | -2 |
| 03/12/2024 | 104.00 | 6.32% | 0 |
| 26/02/2025 | 99.13 | 6.34% | 0 |
| 12/06/2025 | 99.25 | 6.37% | 0 |
| 28/11/2026 | 100.00 | 6.60% | 0 |
| 23/03/2027 | 101.13 | 6.69% | -3 |
| 29/11/2027 | 100.00 | 6.75% | -2 |
| 03/11/2028 | 99.13 | 6.76% | -2 |
| 26/02/2030 | 98.88 | 6.78% | -2 |
| 22/04/2031 | 100.88 | 6.90% | -3 |
| 23/03/2032 | 100.38 | 6.96% | -4 |
| 02/11/2035 | 99.00 | 7.15% | 0 |
| 23/03/2037 | 100.25 | 7.22% | -7 |
| Last Price | Previous | % Change | Y-t-D | |
| $/LBP | 1,514.25 | 1,514.25 | – | |
| €/LBP | 1,691.87 | 1,690.06 | 0.11% | |
| £/LBP | 1,940.30 | 1,950.86 | -0.54% | |
| NEER | 114.63 | 114.54 | 0.08% | -3.19% |
Closing Date: 26 May 2017