
Discover today’s performance of BLOM indices, the closing prices of Lebanese stocks and Eurobonds, as well as the exchange rate of major currencies against the LBP.
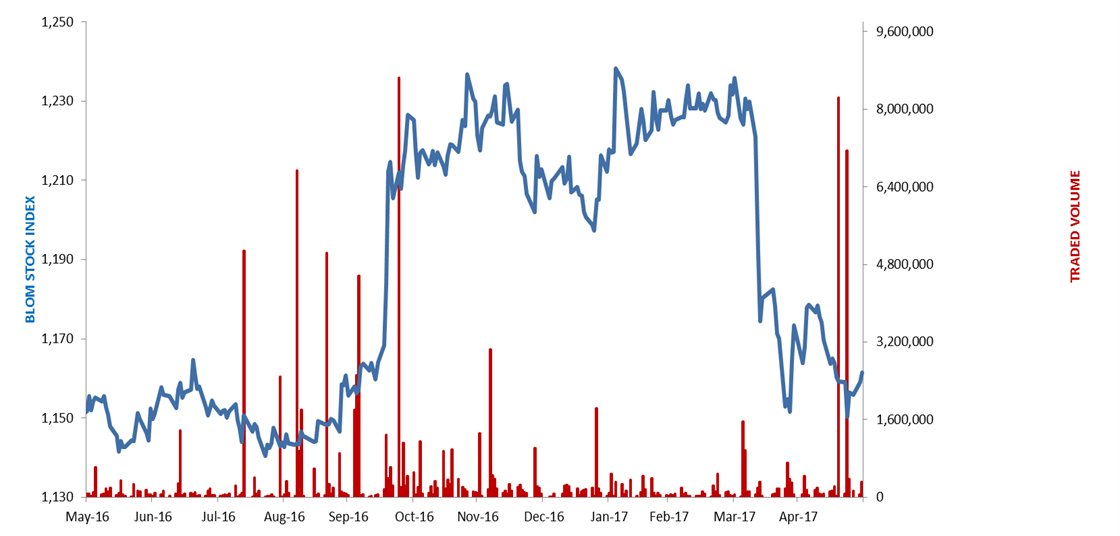
BLOM Stock Index (BSI): Today’s Performance
| Last | Previous | % Change | Y-t-D Change | |
| BSI | 1,161.45 | 1,159.12 | 0.20% | -4.23% |
| High | 1,163.60 | 1,161.65 | ||
| Low | 1,159.49 | 1,156.22 | ||
| Volume | 309,475 | 53,595 | 477.43% | |
| Val ($) | 2,407,718 | 480,675 | 400.90% |
BLOM Preferred Shares Index (BPSI): Today’s Performance
| Last | Previous | Change | |
| BPSI | 104.79 | 104.95 | -0.15% |
| Volume | 8,764 | – | |
| Value | 459,005 | – |
Lebanese Stocks: Today’s Trades and Closing Prices
| Last Price ($) | % Change | Volume | VWAP ($) | |
| Solidere A | 8.91 | -0.22% | 56,108 | 8.91 |
| Solidere B | 8.98 | 1.35% | 143 | 8.98 |
| Bank Audi | 5.99 | -0.33% | 62,526 | 5.99 |
| Bank Audi GDR | 6.20 | 2.14% | 39,118 | 6.08 |
| Bank of Beirut Pref H | 25.15 | 0.00% | 2,000 | 25.15 |
| Bank of Beirut Pref I | 25.15 | 0.00% | 600 | 25.15 |
| Bank of Beirut Pref K | 25.15 | 0.00% | 3,000 | 25.15 |
| Byblos Bank – Listed Shares | 1.65 | 0.00% | 82,866 | 1.65 |
| Byblos Bank – Pref 2009 | 100.60 | -1.37% | 3,164 | 100.56 |
| Blom – Listed Shares | 10.85 | 0.46% | 10,000 | 10.85 |
| Blom GDR | 11.80 | 0.00% | 49,950 | 11.80 |
The BLOM Stock Index
Lebanese Global Depository Receipts: Last session’s Performance
| GDRs | Last Price ($) | Previous Price ($) | % Change | Volume | Value ($) |
| BLOM GDR | 11.80 | 11.80 | – | – | – |
| Audi GDR | 6.10 | 6.10 | – | 5,211 | 31,787 |
| Byblos GDR | 82.00 | 82.00 | – | – | – |
| Solidere GDR | 8.82 | 8.82 | – | – |
Source: Reuters
Closing Date: 26 May 2017
BLOM BOND INDEX: Last Session’s Performance
| Last | Previous | Change | Y-t-D Change | ||
| BBI | 105.70 | 105.67 | 0.03% | 3.73% | |
| Weighted Yield | 5.955% | 5.960% | -0.44 | bps | |
| Duration (Years) | 5.34 | 5.31 | |||
| 5Y Bond Yield | 5.71% | 5.72% | -1 | bps | |
| 5Y Spread* | 392 | 393 | -0.5 | bps | |
| 10Y Bond Yield | 6.63% | 6.63% | 0 | bps | |
| 10Y Spread* | 438 | 438 | 0 | bps | |
*between Lebanese Eurobonds and US Treasuries
Closing Date: 29 May 2017
Lebanese Eurobonds: Last Sessions’ Prices and Yields
| Price | Yield | Yield Change | |
| 12/06/2018 | 100.63 | 4.52% | 0 |
| 12/11/2018 | 100.75 | 4.61% | 0 |
| 23/04/2019 | 101.05 | 4.91% | 0 |
| 20/05/2019 | 102.00 | 4.92% | 0 |
| 28/11/2019 | 101.00 | 5.02% | 0 |
| 09/03/2020 | 102.65 | 5.33% | 0 |
| 14/04/2020 | 101.00 | 5.42% | 0 |
| 19/06/2020 | 101.95 | 5.45% | 0 |
| 12/04/2021 | 109.25 | 5.56% | -1 |
| 04/10/2022 | 101.50 | 5.77% | 0 |
| 27/01/2023 | 100.88 | 5.81% | 0 |
| 22/04/2024 | 102.38 | 6.22% | 0 |
| 04/11/2024 | 99.88 | 6.27% | 0 |
| 03/12/2024 | 104.25 | 6.28% | 0 |
| 26/02/2025 | 99.38 | 6.30% | 0 |
| 12/06/2025 | 99.50 | 6.33% | 0 |
| 28/11/2026 | 100.50 | 6.53% | 0 |
| 23/03/2027 | 101.63 | 6.62% | 0 |
| 29/11/2027 | 100.63 | 6.67% | 0 |
| 03/11/2028 | 99.63 | 6.70% | 0 |
| 26/02/2030 | 99.25 | 6.74% | 0 |
| 22/04/2031 | 101.00 | 6.89% | 0 |
| 23/03/2032 | 100.75 | 6.92% | 0 |
| 02/11/2035 | 100.00 | 7.05% | 0 |
| 23/03/2037 | 101.38 | 7.12% | -9 |
| Last Price | Previous | % Change | Y-t-D | |
| $/LBP | 1,514.00 | 1,514.25 | -0.02% | |
| €/LBP | 1,684.33 | 1,682.97 | 0.08% | |
| £/LBP | 1,938.80 | 1,935.33 | 0.18% | |
| NEER | 114.49 | 114.44 | 0.04% | -3.31% |
Closing Date: 30 May 2017