
Discover today’s performance of BLOM indices, the closing prices of Lebanese stocks and Eurobonds, as well as the exchange rate of major currencies against the LBP.
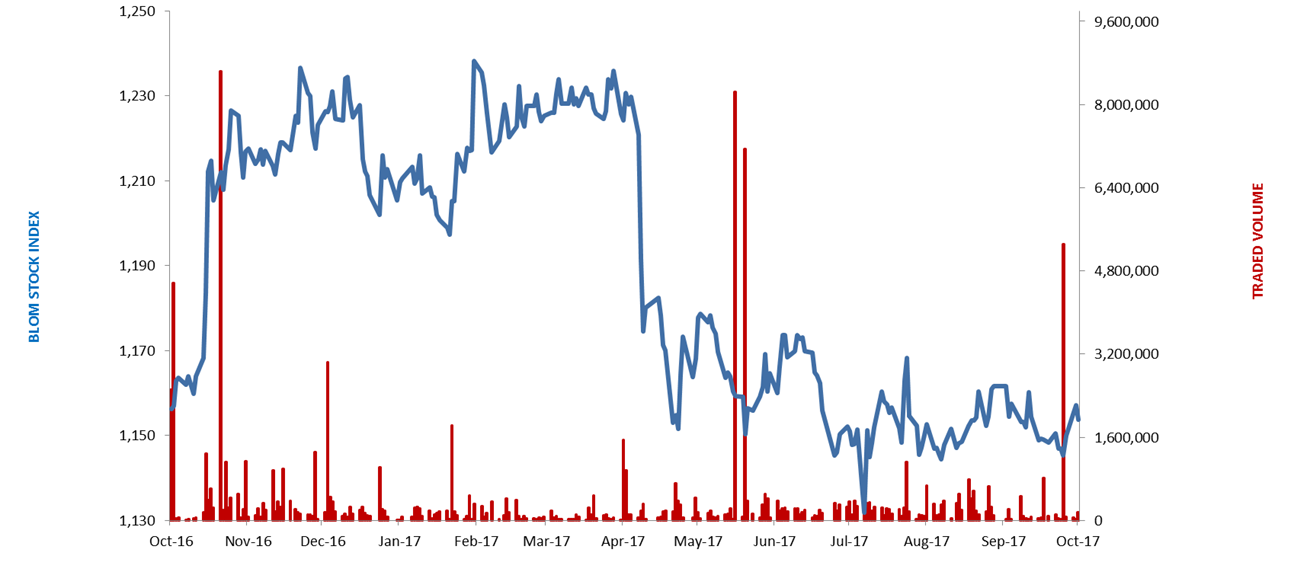
BLOM Stock Index (BSI): Today’s Performance
| Last | Previous | % Change | Y-t-D Change | |
| BSI | 1,151.18 | 1,154.68 | -0.303% | -5.08% |
| High | 1,150.69 | 1,155.21 | ||
| Low | 1,152.54 | 1,153.45 | ||
| Volume | 66,462 | 526,552 | -87.38% | |
| Val ($) | 631,617 | 4,903,291 | -87.12% |
BLOM Preferred Shares Index (BPSI): Today’s Performance
| Last | Previous | Change | |
| BPSI | 105.30 | 105.29 | 0.01% |
| Volume | 1,300 | – | |
| Value | 70,830 | – |
Lebanese Stocks: Today’s Trades and Closing Prices
| Last Price ($) | % Change | Volume | VWAP ($) | |
| Solidere A | 7.92 | -0.87% | 19,790 | 7.92 |
| Solidere B | 7.94 | -0.25% | 12,677 | 7.94 |
| Bank Audi | 5.82 | -0.51% | 57 | 5.82 |
| Bank Audi GDR | 6 | – | 10,000 | 6 |
| Bank Audi Preferred G | 101.1 | 0.09% | 500 | 101.1 |
| Bank of Beirut Preferred H | 25.35 | – | 800 | 25.35 |
| Byblos Bank | 1.61 | – | 4,500 | 1.61 |
| BLOM Bank GDR | 12.6 | 0.07% | 3,000 | 12.6 |
| BLOM Bank Listed shares | 11.6 | -0.42% | 4,500 | 11.6 |
| HOLCIM | 13.76 | -1.64% | 10,608 | 13.76 |
The BLOM Stock Index
Lebanese Global Depository Receipts: Last session’s Performance
| GDRs | Last Price ($) | Previous Price ($) | % Change | Volume | Value ($) |
| BLOM GDR | 12.6 | 12.6 | 0.0% | – | – |
| Audi GDR | 6 | 6 | 0.0% | 50,680 | 304,080 |
| Byblos GDR | 77 | 77.1 | -0.1% | 31 | 2,387 |
Source: London Stock Exchange
Closing Date: 09 Oct 2017
BLOM BOND INDEX: Last Session’s Performance
| Last | Previous | Change | Y-t-D Change | ||
| BBI | 103.94 | 103.94 | 0.00% | 2.00% | |
| Weighted Yield | 6.276% | 6.277% | 0 | bps | |
| Duration (Years) | 5.18 | 5.19 | |||
| 5Y Bond Yield | 6.05% | 6.05% | 0 | bps | |
| 5Y Spread* | 408 | 408 | 0 | bps | |
| 10Y Bond Yield | 6.92% | 6.92% | 0 | bps | |
| 10Y Spread* | 455 | 455 | 0 | bps | |
*between Lebanese Eurobonds and US Treasuries
Closing Date: 09 Oct 2017
Lebanese Eurobonds: Last Sessions’ Prices and Yields
| Price | Yield | Yield Change | |
| 12/11/2018 | 100.25 | 4.91% | 0 |
| 23/04/2019 | 100.65 | 5.06% | 0 |
| 20/05/2019 | 101.38 | 5.10% | 0 |
| 28/11/2019 | 100.38 | 5.26% | 0 |
| 09/03/2020 | 102.25 | 5.37% | 0 |
| 14/04/2020 | 100.50 | 5.58% | 0 |
| 19/06/2020 | 101.25 | 5.64% | 0 |
| 12/04/2021 | 107.88 | 5.74% | 0 |
| 04/10/2022 | 100.13 | 6.07% | 0 |
| 27/01/2023 | 98.75 | 6.28% | 0 |
| 22/04/2024 | 100.25 | 6.60% | 0 |
| 04/11/2024 | 98.13 | 6.58% | 0 |
| 03/12/2024 | 102.00 | 6.64% | 0 |
| 26/02/2025 | 97.38 | 6.65% | 0 |
| 12/06/2025 | 97.38 | 6.69% | 0 |
| 28/11/2026 | 98.38 | 6.84% | 0 |
| 23/03/2027 | 99.75 | 6.89% | 0 |
| 29/11/2027 | 98.75 | 6.92% | 0 |
| 03/11/2028 | 97.25 | 7.01% | 0 |
| 26/02/2030 | 96.75 | 7.05% | 0 |
| 22/04/2031 | 98.25 | 7.20% | 0 |
| 23/03/2032 | 97.63 | 7.27% | 0 |
| 02/11/2035 | 97.25 | 7.33% | 0 |
| 23/03/2037 | 97.00 | 7.55% | 0 |
| Last Price | Previous | % Change | Y-t-D | |
| $/LBP | 1,514.00 | 1,514.00 | – | |
| €/LBP | 1,769.81 | 1,768.60 | 0.07% | |
| £/LBP | 1,988.69 | 1,970.15 | 0.94% | |
| NEER | 111.82 | 112.03 | -0.19% | -5.56% |
Closing Date: 10 Oct 2017