
Discover today’s performance of BLOM indices, the closing prices of Lebanese stocks and Eurobonds, as well as the exchange rate of major currencies against the LBP.
BLOM Stock Index (BSI): Today’s Performance
| Last | Previous | % Change | Y-t-D Change | |
| BSI | 1,154.48 | 1,154.71 | -0.021% | -4.80% |
| High | 1,155.14 | 1,155.14 | ||
| Low | 1,154.20 | 1,154.22 | ||
| Volume | 98,187 | 54,784 | 79.23% | |
| Val ($) | 762,560 | 982,662 | -22.40% |
BLOM Preferred Shares Index (BPSI): Today’s Performance
| Last | Previous | Change | |
| BPSI | 105.36 | 105.36 | 0.00% |
| Volume | 250 | 4,525 | |
| Value | 25,000 | 457,492 |
Lebanese Stocks: Today’s Trades and Closing Prices
| Last Price ($) | % Change | Volume | VWAP ($) | |
| Solidere A | 8.02 | -0.12% | 14,700 | 8 |
| Solidere B | 7.99 | -0.12% | 2,902 | 7.99 |
| BLC Bank Pref D | 100 | 0.00% | 250 | 100 |
| Bank Audi GDR | 5.99 | -0.17% | 56,000 | 5.99 |
| Byblos Bank Listed | 1.61 | 0.00% | 3,000 | 1.61 |
| BLOM Bank Listed | 11.6 | 0.00% | 13,000 | 11.6 |
| BLOM Bank GDR | 12.66 | 0.08% | 8,335 | 12.66 |
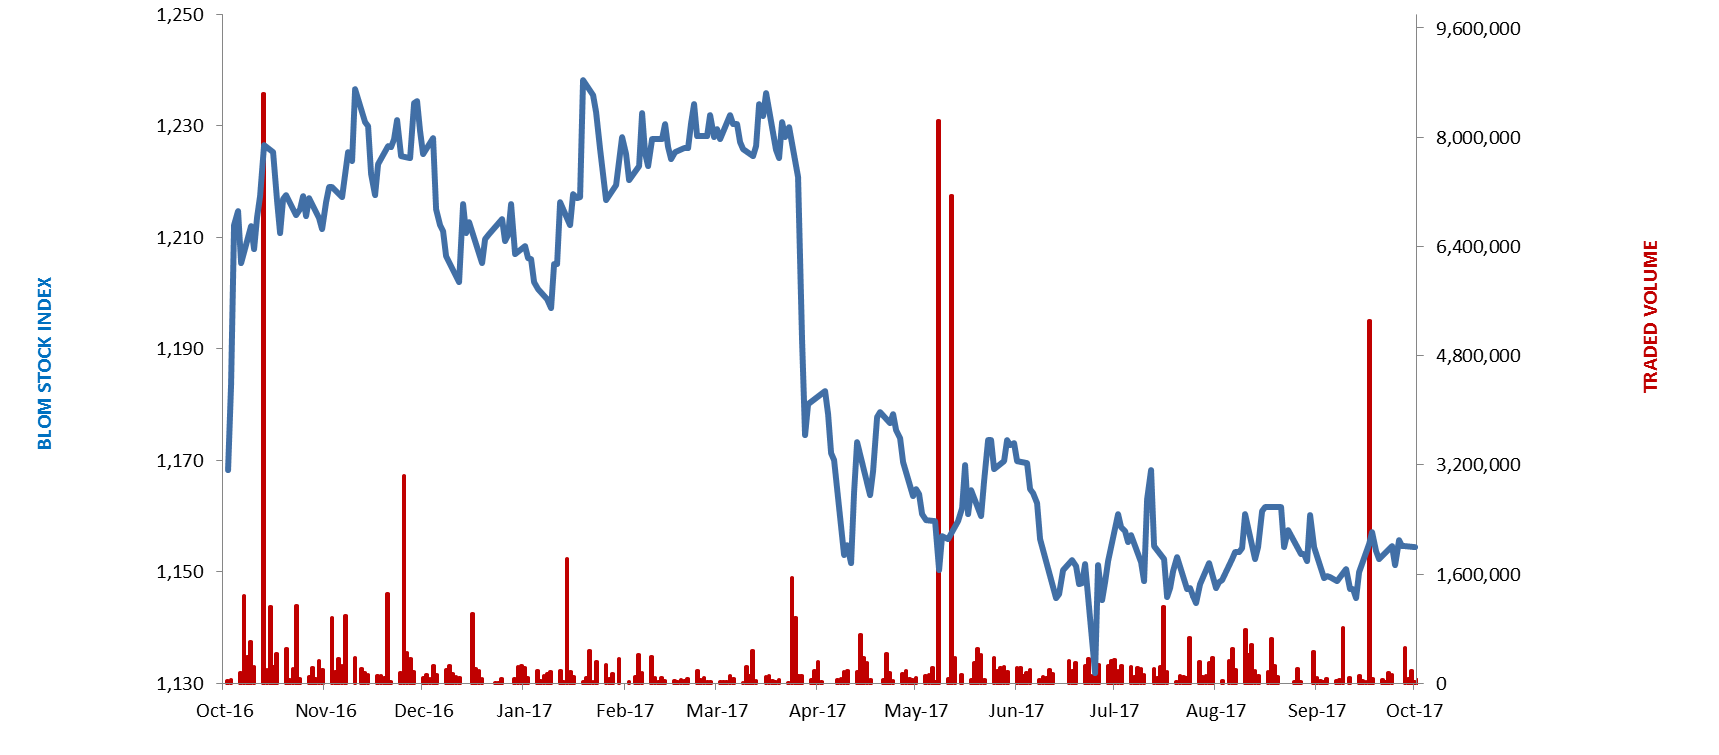
The BLOM Stock Index
Lebanese Global Depository Receipts: Last session’s Performance
| GDRs | Last Price ($) | Previous Price ($) | % Change | Volume | Value ($) |
| BLOM GDR | 12.45 | 12.6 | -1.2% | 13,663 | 171,595 |
| Audi GDR | 6 | 6 | 0.0% | – | – |
| Byblos GDR | 77 | 77 | 0.0% | – | – |
Source: London Stock Exchange
Closing Date: 13 October 2017
BLOM BOND INDEX: Last Session’s Performance
| Last | Previous | Change | Y-t-D Change | ||
| BBI | 103.94 | 103.75 | 0.18% | 2.00% | |
| Weighted Yield | 6.247% | 6.298% | -5 | bps | |
| Duration (Years) | 5.18 | 5.18 | |||
| 5Y Bond Yield | 6.01% | 6.12% | -11 | bps | |
| 5Y Spread* | 410 | 417 | -7 | bps | |
| 10Y Bond Yield | 6.92% | 6.95% | -3 | bps | |
| 10Y Spread* | 464 | 462 | 2 | bps | |
*between Lebanese Eurobonds and US Treasuries
Closing Date: 13 October 2017
Lebanese Eurobonds: Last Sessions’ Prices and Yields
| Price | Yield | Yield Change | |
| 12/11/2018 | 100.75 | 4.43% | 0 |
| 23/04/2019 | 100.75 | 4.98% | -8 |
| 20/05/2019 | 101.50 | 5.01% | -8 |
| 28/11/2019 | 100.63 | 5.13% | -13 |
| 09/03/2020 | 102.38 | 5.31% | -6 |
| 14/04/2020 | 100.75 | 5.48% | -11 |
| 19/06/2020 | 101.38 | 5.59% | -10 |
| 12/04/2021 | 107.50 | 5.85% | 4 |
| 04/10/2022 | 100.38 | 6.01% | -12 |
| 27/01/2023 | 98.88 | 6.25% | -6 |
| 22/04/2024 | 100.25 | 6.60% | -5 |
| 04/11/2024 | 98.00 | 6.61% | 0 |
| 03/12/2024 | 101.88 | 6.66% | 0 |
| 26/02/2025 | 97.13 | 6.70% | 0 |
| 12/06/2025 | 97.13 | 6.73% | 0 |
| 28/11/2026 | 98.13 | 6.88% | 0 |
| 23/03/2027 | 99.75 | 6.89% | -4 |
| 29/11/2027 | 98.75 | 6.92% | -4 |
| 03/11/2028 | 97.13 | 7.03% | -3 |
| 26/02/2030 | 96.50 | 7.08% | -2 |
| 22/04/2031 | 98.25 | 7.20% | 0 |
| 23/03/2032 | 97.50 | 7.28% | -3 |
| 02/11/2035 | 97.00 | 7.35% | -4 |
| 23/03/2037 | 97.63 | 7.48% | -8 |
| Last Price | Previous | % Change | Y-t-D | |
| $/LBP | 1,514.00 | 1,514.00 | – | |
| €/LBP | 1,778.70 | 1,782.17 | -0.19% | |
| £/LBP | 2,001.36 | 2,006.63 | -0.26% | |
| NEER | 111.59 | 111.86 | -0.24% | -5.76% |
Closing Date: 16 October 2017