
Discover today’s performance of BLOM indices, the closing prices of Lebanese stocks and Eurobonds, as well as the exchange rate of major currencies against the LBP.
BLOM Stock Index (BSI): Today’s Performance
| Last | Previous | % Change | Y-t-D Change | |
| BSI | 1,131.01 | 1,130.48 | 0.05% | -1.53% |
| High | 1,131.98 | 1,132.47 | ||
| Low | 1,127.54 | 1,129.87 | ||
| Volume | 173,113 | 1,237,965 | -86.02% | |
| Val ($) | 1,364,226 | 7,096,511 | -80.78% |
BLOM preferred Shares Index (BPSI): Today’s Performance
| Last | Previous | Change | |
| BPSI | 104.74 | 104.74 | 0.00% |
| Volume | – | 1,814 | |
| Value | – | 179,636 |
Lebanese Stocks: Today’s Trades and Closing Prices
| Last Price ($) | % Change | Volume | VWAP ($) | |
| Solidere A | 8.52 | 1.42% | 29,295 | 8.52 |
| Solidere B | 8.49 | 0.71% | 40,696 | 8.49 |
| Bank Audi | 5.73 | -0.17% | 45,320 | 5.73 |
| Bank Audi GDR | 5.8 | – | 26,333 | 5.8 |
| Byblos Bank – Listed | 1.5 | – | 7,234 | 1.5 |
| Byblos Bank Preferred 2008 | 99 | – | 150 | 99 |
| Byblos Bank Preferred 2009 | 99 | – | 510 | 99 |
| BLOM Listed | 11.05 | -0.45% | 14,645 | 11.05 |
| BLOM GDR | 11.62 | 0.17% | 4,770 | 11.62 |
| HOLCIM | 14.99 | 0.87% | 4,160 | 14.99 |
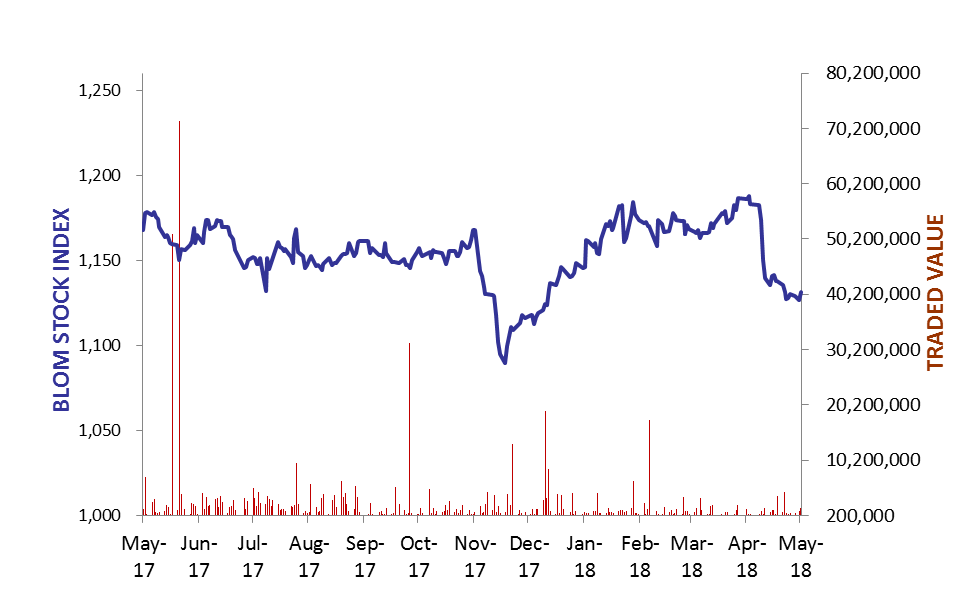
The BLOM Stock Index
Lebanese Global Depository Receipts: Last session’s Performance
| GDRs | Last Price ($) | Previous Price ($) | % Change | Volume | Value ($) |
| BLOM GDR | 11.6 | 11.6 | 0.0% | 29,380 | 340,808 |
| Audi GDR | 5.75 | 5.75 | 0.0% | 8,000 | 45,958 |
| Byblos GDR | 76.5 | 76.5 | 0.0% | – | – |
Source: London Stock Exchange
Closing Date: 08 May 2018
BLOM BOND INDEX: Last Session’s Performance
| Last | Previous | Change | Y-t-D Change | ||
| BBI | 94.95 | 96.62 | -1.73% | -6.05% | |
| Weighted Yield | 8.31% | 7.91% | 40 | bps | |
| Duration (Years) | 4.88 | 4.91 | |||
| 5Y Bond Yield | 8.40% | 7.75% | 65 | bps | |
| 5Y Spread* | 559 | 497 | 62 | bps | |
| 10Y Bond Yield | 8.82% | 8.48% | 34 | bps | |
| 10Y Spread* | 585 | 553 | 32 | bps | |
*between Lebanese Eurobonds and US Treasuries
Closing Date: 08 May 2018
Lebanese Eurobonds: Last Sessions’ Prices and Yields
| Price | Yield | Yield Change | |
| 23/04/2019 | 98.63 | 7.00% | 41 |
| 20/05/2019 | 99.00 | 7.02% | 39 |
| 28/11/2019 | 97.63 | 7.08% | 35 |
| 09/03/2020 | 98.38 | 7.33% | 30 |
| 14/04/2020 | 97.13 | 7.42% | 29 |
| 19/06/2020 | 97.38 | 7.51% | 33 |
| 12/04/2021 | 99.50 | 8.44% | 68 |
| 04/10/2022 | 91.75 | 8.38% | 57 |
| 27/01/2023 | 91.25 | 8.27% | 44 |
| 22/04/2024 | 91.25 | 8.55% | 46 |
| 04/11/2024 | 89.00 | 8.49% | 38 |
| 03/12/2024 | 92.50 | 8.51% | 39 |
| 26/02/2025 | 88.25 | 8.51% | 37 |
| 12/06/2025 | 88.00 | 8.54% | 36 |
| 28/11/2026 | 87.00 | 8.79% | 36 |
| 23/03/2027 | 88.00 | 8.83% | 35 |
| 29/11/2027 | 86.75 | 8.83% | 34 |
| 03/11/2028 | 85.25 | 8.84% | 32 |
| 26/02/2030 | 84.00 | 8.86% | 34 |
| 22/04/2031 | 85.75 | 8.87% | 29 |
| 23/03/2032 | 85.25 | 8.87% | 26 |
| 02/11/2035 | 84.00 | 8.87% | 25 |
| 23/03/2037 | 84.25 | 9.00% | 37 |
| Last Price | Previous | % Change | Y-t-D | |
| $/LBP | 1,514.25 | 1,514.25 | – | |
| €/LBP | 1,790.61 | 1,788.50 | 0.12% | |
| £/LBP | 2,048.69 | 2,042.21 | 0.32% | |
| NEER | 112.30 | 112.55 | -0.22% | 1.24% |
Closing Date: 09 May 2018