
Lebanon’s trade deficit for the first three months of 2018 (“Q1” hereafter) stood at $3.9B, narrowing from $4.2B in Q1 2017, on the back of total imports that retreated by an annual 2.9% to $4.8B, while total exports grew by a yearly 11.2% to $814.5M.
“Mineral products” were the leading imports to Lebanon in Q1 2018, grasping a 17.8% stake of total imported goods. “Products of the chemical or allied industries” followed, constituting 11.69% of the total, while “machinery and electrical instruments” grasped 11.3% of the total.
In details, the worth of the imported “mineral products” fell to $856.6M, representing a 28.6% year-on-year (y-o-y) contraction, on the back of a 39.8% yearly decline in their imported volume by March 2018. In fact, prior to Jan. 2018 when the raise in Lebanon’s VAT rate to 11% from 10% materialized, large amounts of oil (Lebanon’s main traded mineral product) were imported to avoid purchases at the higher VAT at least over Q1 of the year.
Meanwhile, the value of “chemical or allied industries” recorded an uptick of 6.39% y-o-y to settle at $562.5M and that of “machinery and electrical instruments” also rose by 21.2% over the sam period to $546.6M.
In terms of top trade partners, Lebanon primarily imported from China, Italy, and Greece with shares of 9.6%, 8.5% and 6.9%, respectively, in the month of March 2018.
As for exports, the top category of products exported from Lebanon were “pearls, precious stones and metals”, which grasped a share of 29.1% of total exports, followed by a share of 14.4% for “base metals and articles of base metal” and 13.1% for “prepared foodstuffs, beverage, and tobacco ”over the same period.
In details, the value of “pearls, precious stones, & metals” surged in Q1 2018 to reach $237.4M, compared to $178.5M in Q1 2017. In turn, the value of “base metals and articles of base metal” increased by 14.4% y-o-y to $117.3M. Meanwhile, the value of “prepared foodstuffs, beverage, and tobacco” slid by a yearly 5.05% to $106.9M.
In March 2018, the UAE, followed by South Africa and Saudi Arabia were Lebanon’s top three export destinations, respectively constituting 12.5%, 6.9%, and 6.3% of total exports.
Lebanon’s Trade Deficit in Q1 (in $B)
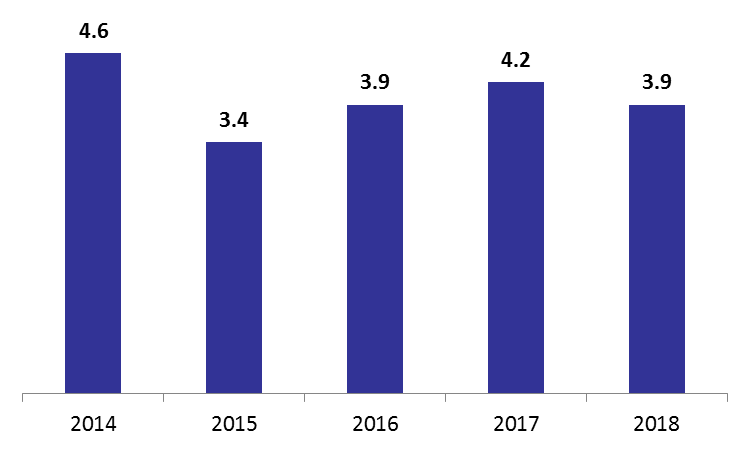
Source: Lebanese Customs