According to Global Blue, tourist spending rose by 4.99% since year start in the first half of the year.
The highest number of refund transactions was executed during the month of January with 27% of the total followed by 16% executed in each of the months of March and April 2018.
Saudi Arabian and UAE tourists each accounted for 11% of total tourist spending followed by 10% accounted for by Syrian tourists and 7% for Kuwaiti tourists.
In line with the decreased number of wealthy Gulf tourists, the spending of Saudi Arabian tourists slid by 21.43% in the first half of the year 2018 compared to the same period last year while the spending of UAE tourists slid by 1.09%. However, the spending evolution of Syrian tourists showed a 98.22% surge over the same period.
During the first half of the year, Fashion and clothing remained the biggest category, accounting for 66% of total tourist spending followed by 19% for Watches and Jewelry and 4% for Home & Garden.
On a year-on-year basis, Watches and Jewelry was the only category to have witnessed a 24.46% increase as Fashion and Clothing slid by 0.46% and Home and Garden slid by 4.05%.
The capital Beirut is where 81% of tourist spending was concentrated, while 13% was disbursed in Metn (Mount Lebanon), and 3% was disbursed in Baabda.
Yearly Evolution of Tourist spending by area in H1 2018
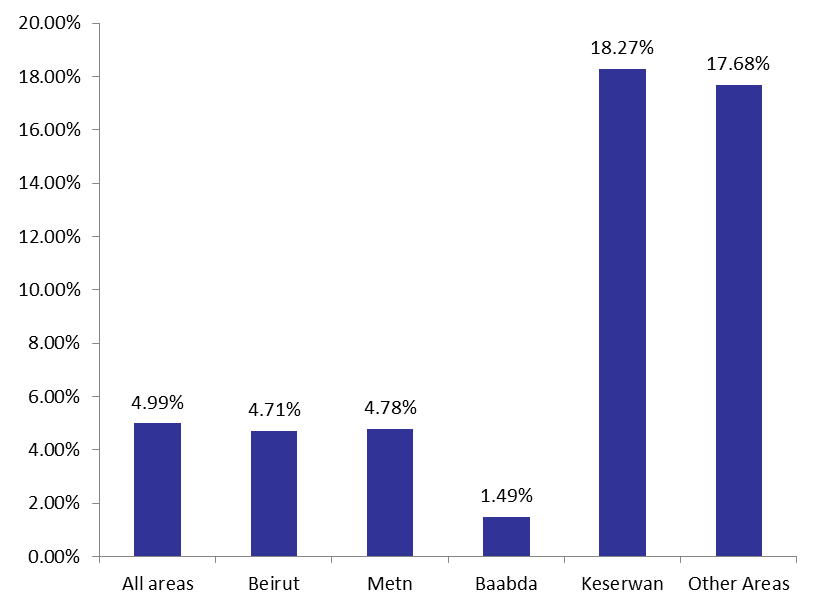
Sources: Global Blue Tourist Spending Report