Discover today’s performance of BLOM indices, the closing prices of Lebanese stocks and Eurobonds, as well as the exchange rate of major currencies against the LBP.
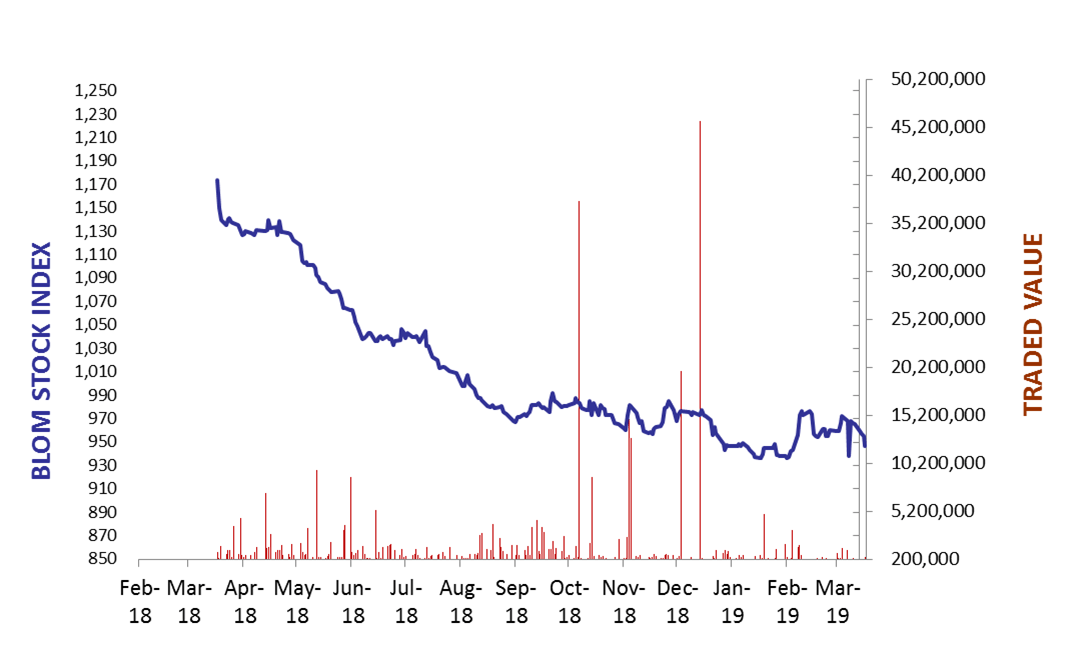
BLOM Stock Index (BSI) – today’s performance
| Last | Previous | % Change | Y-t-D Change | |
| BSI | 946.90 | 955.05 | -0.85% | -2.23% |
| High | 958.80 | 958.80 | ||
| Low | 945.80 | 954.80 | ` | |
| Volume | 82,903 | 23,054 | ||
| Val ($) | 468,165 | 133,472 |
I): Today’s Performance:
BLOM preferred Shares Index (BPSI): today’s Performance
| Last | Previous | Change | |
| BPSI | 87.13 | 87.13 | 0.00% |
| Volume | 114 | 50 | |
| Value | 8,664 | 3,800 |
Lebanese Stocks: today’s Trades and Closing Prices
| Last Price ($) | % Change | Volume | VWAP ($) | |
| Solidere A | 6 | 5.45% | 51,986 | 6.00 |
| Solidere B | 5.82 | 2.65% | 7,803 | 5.82 |
| Bank Audi | 4.67 | -4.50% | 3,000 | 4.67 |
| Byblos Bank – Listed Shares | 1.35 | -0.74% | 10,000 | 1.35 |
| Byblos Bank Pref 2009 | 76 | 0.00% | 114 | 76 |
| BLOM GDR | 9 | -3.85% | 10,000 | 9 |
The BLOM Stock Index
Lebanese Global Depository Receipts: Last session’s Performance
| GDRs | Last Price ($) | Previous Price ($) | % Change | Volume | Value ($) |
| BLOM GDR | 9 | 9.05 | -0.55% | 7,311 | 65,568 |
| Audi GDR | 5.05 | 4.62 | 9.31% | 500 | 2,525 |
| Byblos GDR | 77 | 77 | 0.00% |
Closing Date: 11 April 2019
Source: London Stock Exchange
BLOM BOND INDEX: Last Session’s Performance
| Last | Previous | Change | Y-t-D Change | ||
| BBI | 92.97 | 93.45 | -0.514% | -8.00% | |
| Weighted Yield | 9.65% | 9.51% | 14 | bps | |
| Duration (Years) | 4.75 | 4.76 | |||
| 5Y Bond Yield | 9.91% | 9.72% | 19 | bps | |
| 5Y Spread* | 761 | 745 | 16 | bps | |
| 10Y Bond Yield | 9.89% | 9.78% | 11 | bps | |
| 10Y Spread* | 749 | 741 | 8 | bps | |
*between Lebanese Eurobonds and US Treasuries
Closing Date: 11 April 2019
Lebanese Eurobonds: Last Sessions’ Prices and Yields
| Price | Yield | Yield Change | |
| 09/03/2020 | 97.38 | 9.44% | 45 |
| 14/04/2020 | 96.56 | 9.47% | 31 |
| 19/06/2020 | 96.27 | 9.54% | 23 |
| 12/04/2021 | 96.29 | 10.35% | 17 |
| 04/10/2022 | 89.23 | 9.84% | 17 |
| 27/01/2023 | 87.79 | 9.94% | 15 |
| 22/04/2024 | 86.45 | 10.17% | 17 |
| 04/11/2024 | 84.48 | 9.97% | 13 |
| 03/12/2024 | 86.45 | 10.26% | 19 |
| 26/02/2025 | 84.41 | 9.76% | 13 |
| 12/06/2025 | 84.86 | 9.56% | 11 |
| 28/11/2026 | 83.16 | 9.79% | 11 |
| 23/03/2027 | 83.30 | 9.94% | 10 |
| 29/11/2027 | 82.18 | 9.87% | 10 |
| 03/11/2028 | 81.42 | 9.69% | 9 |
| 26/02/2030 | 79.66 | 9.73% | 12 |
| 22/04/2031 | 79.17 | 10.05% | 17 |
| 23/03/2032 | 80.64 | 9.66% | 13 |
| 02/11/2035 | 79.50 | 9.55% | 18 |
| 23/03/2037 | 80.12 | 9.61% | 11 |
Lebanese Forex Market
| Last Price | Previous | % Change | Y-t-D | |
| $/LBP | 1,514.25 | 1,514.25 | – | |
| €/LBP | 1,704.68 | 1,705.28 | -0.04% | |
| £/LBP | 1,973.62 | 1,974.22 | -0.03% | |
| NEER | 118.24 | 118.40 | -0.14% |
Closing Date: 12 April 2019