Discover today’s performance of BLOM indices, the closing prices of Lebanese stocks and Eurobonds, as well as the exchange rate of major currencies against the LBP.
BLOM Stock Index (BSI) – today’s performance
| Last | Previous | % Change | Y-t-D Change | |
| BSI | 865.65 | 839.58 | 3.11% | -14.05% |
| High | 866.70 | 851.40 | ||
| Low | 857.80 | 836.80 | ` | |
| Volume | 40,459 | 189,247 | ||
| Val ($) | 332,111 | 2,695,379 |
I): BLOM preferred Shares Index (BPSI): today’s Performance
| Last | Previous | Change | |
| BPSI | 85.01 | 85.14 | -0.15% |
| Volume | 1,590 | 28,110 | |
| Value | 140,595 | 2,450,334 |
Lebanese Stocks: today’s Trades and Closing Prices
| Last Price ($) | % Change | Volume | VWAP ($) | |
| Solidere A | 5.07 | 0.79% | 890 | 5.07 |
| Solidere B | 5.04 | 3.27% | 7,500 | 5.04 |
| Bank Audi | 4.2 | 5.00% | 1,730 | 4.2 |
| Bank Audi GDR | 4.02 | 1.25% | 8,226 | 4.02 |
| Bank Audi Pref H | 83 | -2.12% | 840 | 83 |
| Byblos Bank | 1.29 | 4.87% | 7,720 | 1.29 |
| Bank BEMO Pref 2013 | 94.5 | -2.27% | 750 | 94.5 |
| BLOM GDR | 7.55 | 0.66% | 10,500 | 7.55 |
| BLOM Listed | 8.55 | 6.87% | 2,303 | 8.55 |
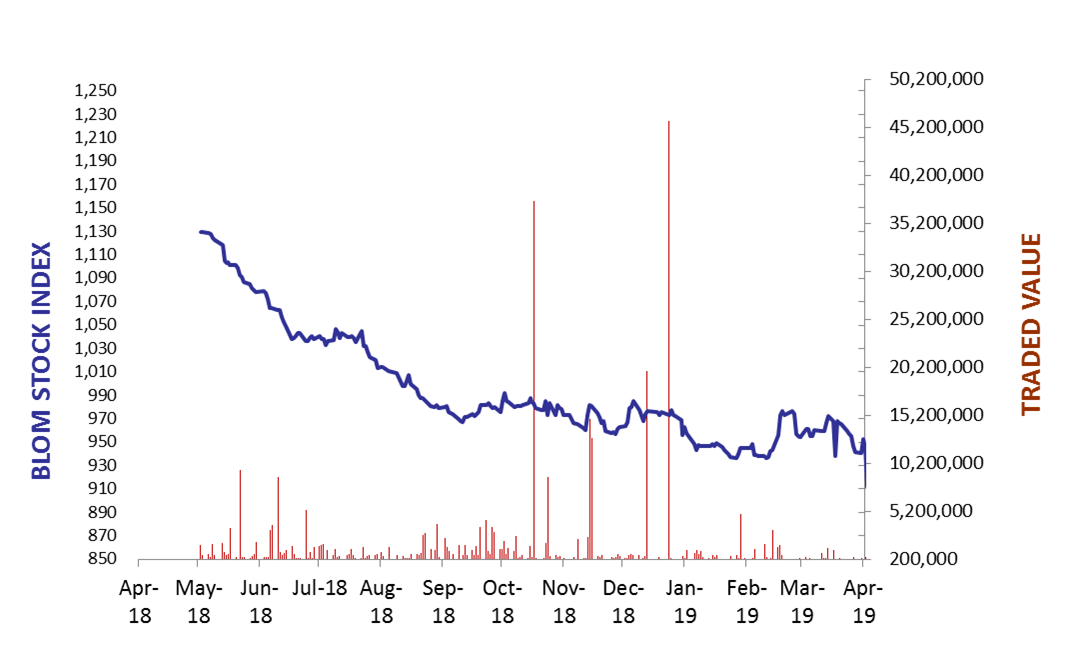
The BLOM Stock Index
Lebanese Global Depository Receipts: Last session’s Performance
| GDRs | Last Price ($) | Previous Price ($) | % Change | Volume | Value ($) |
| BLOM GDR | 7.8 | 7.8 | 0.00% | – | – |
| Audi GDR | 3.98 | 4.3 | -7.44% | 42,816 | 171,280 |
| Byblos GDR | 77 | 77 | 0.00% | – | – |
Closing Date: 17 May 2019
Source: London Stock Exchange
BLOM BOND INDEX: Last Session’s Performance
| Last | Previous | Change | Y-t-D Change | ||
| BBI | 88.18 | 88.69 | -0.570% | -12.74% | |
| Weighted Yield | 10.97% | 10.83% | 13 | bps | |
| Duration (Years) | 4.62 | 4.63 | |||
| 5Y Bond Yield | 11.65% | 11.52% | 13 | bps | |
| 5Y Spread* | 950 | 937 | 13 | bps | |
| 10Y Bond Yield | 11.01% | 10.90% | 11 | bps | |
| 10Y Spread* | 874 | 862 | 12 | bps | |
*between Lebanese Eurobonds and US Treasuries
Closing Date: 17 May 2019
Lebanese Eurobonds: Last Sessions’ Prices and Yields
| Price | Yield | Yield Change | |
| 09/03/2020 | 95.00 | 10.69% | -10 |
| 14/04/2020 | 93.63 | 10.95% | -10 |
| 19/06/2020 | 93.25 | 11.03% | -8 |
| 12/04/2021 | 93.25 | 11.59% | 0 |
| 04/10/2022 | 84.88 | 11.04% | -4 |
| 27/01/2023 | 83.00 | 11.23% | 0 |
| 22/04/2024 | 81.38 | 11.36% | 4 |
| 04/11/2024 | 78.75 | 11.26% | 0 |
| 03/12/2024 | 81.75 | 11.27% | 0 |
| 26/02/2025 | 77.63 | 11.29% | 3 |
| 12/06/2025 | 77.50 | 11.20% | 0 |
| 28/11/2026 | 76.25 | 11.17% | 0 |
| 23/03/2027 | 77.00 | 11.17% | 0 |
| 29/11/2027 | 75.75 | 11.08% | 0 |
| 03/11/2028 | 74.25 | 10.97% | 0 |
| 26/02/2030 | 72.75 | 10.92% | 0 |
| 22/04/2031 | 73.38 | 10.98% | 0 |
| 23/03/2032 | 73.13 | 10.86% | 0 |
| 02/11/2035 | 72.38 | 10.59% | 2 |
| 23/03/2037 | 72.63 | 10.68% | 2 |
Lebanese Forex Market
| Last Price | Previous | % Change | Y-t-D | |
| $/LBP | 1,514.25 | 1,514.25 | – | |
| €/LBP | 1,683.12 | 1,681.77 | 0.08% | |
| £/LBP | 1,919.95 | 1,917.24 | 0.14% | |
| NEER | 119.81 | 119.83 | -0.02% |
Closing Date: 20 May 2019