Discover today’s performance of BLOM indices, the closing prices of Lebanese stocks and Eurobonds, as well as the exchange rate of major currencies against the LBP.
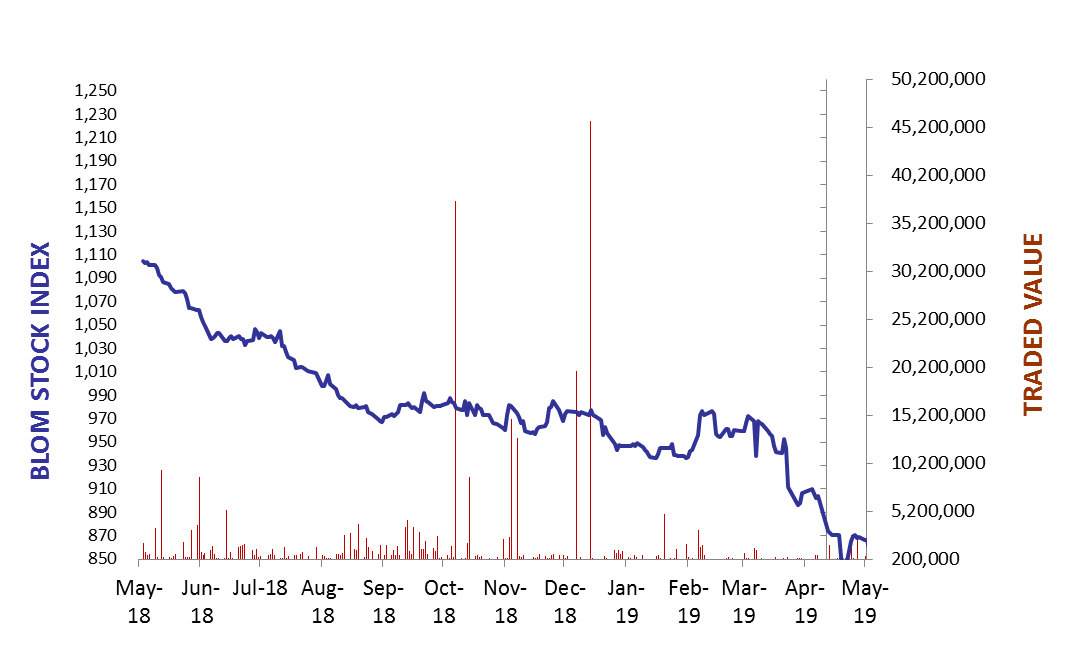
BLOM Stock Index (BSI) – today’s performance
| Last | Previous | % Change | Y-t-D Change | |
| BSI | 858.76 | 866.32 | -0.87% | -11.31% |
| High | 862.20 | 867.20 | ||
| Low | 854.30 | 854.30 | ` | |
| Volume | 35,806 | 54,046 | ||
| Val ($) | 256,642 | 288,046 |
I): BLOM preferred Shares Index (BPSI): today’s Performance
| Last | Previous | Change | |
| BPSI | 85.01 | 85.01 | 0.00% |
| Volume | – | – | |
| Value | – | – |
Lebanese Stocks: today’s Trades and Closing Prices
| Last Price ($) | % Change | Volume | VWAP ($) | |
| Solidere A | 5.18 | 1.77% | 1,979 | 5.18 |
| Solidere B | 5.05 | 0.60% | 1,006 | 5.05 |
| Bank Audi | 4 | -5.66% | 111 | 4 |
| Byblos Bank – Listed Shares | 1.27 | 1.60% | 1,710 | 1.27 |
| BLOM GDR | 7.7 | 0.00% | 31,000 | 7.7 |
The BLOM Stock Index
Lebanese Global Depository Receipts: Last session’s Performance
| GDRs | Last Price ($) | Previous Price ($) | % Change | Volume | Value ($) |
| BLOM GDR | 7.65 | 7.7 | -0.65% | 6,977 | 53,719 |
| Audi GDR | 4 | 4.3 | -6.98% | 4,337 | 17,456 |
| Byblos GDR | 77 | 77 | 0.00% | – | – |
Closing Date: 28 May 2019
Source: London Stock Exchange
BLOM BOND INDEX: Last Session’s Performance
| Last | Previous | Change | Y-t-D Change | ||
| BBI | 89.52 | 89.34 | 0.20% | -11.42% | |
| Weighted Yield | 10.84% | 10.87% | -3 | bps | |
| Duration (Years) | 5.20 | 5.18 | |||
| 5Y Bond Yield | 10.41% | 11.43% | -102 | bps | |
| 5Y Spread* | 835 | 933 | -98 | bps | |
| 10Y Bond Yield | 10.75% | 10.80% | -5 | bps | |
| 10Y Spread* | 859 | 858 | 1 | bps | |
*between Lebanese Eurobonds and US Treasuries
Closing Date: 28 May 2019
Lebanese Eurobonds: Last Sessions’ Prices and Yields
| Price | Yield | Yield Change | |
| 12/04/2021 | 95.38 | 11.04% | 6 |
| 04/10/2022 | 85.74 | 11.33% | -7 |
| 27/01/2023 | 84.00 | 11.46% | -3 |
| 22/04/2024 | 82.32 | 11.46% | -7 |
| 04/11/2024 | 80.38 | 11.16% | -5 |
| 03/12/2024 | 82.59 | 11.33% | -8 |
| 26/02/2025 | 80.03 | 10.97% | -5 |
| 12/06/2025 | 80.67 | 10.67% | -7 |
| 28/11/2026 | 79.13 | 10.72% | -4 |
| 23/03/2027 | 79.22 | 10.86% | -4 |
| 29/11/2027 | 78.05 | 10.75% | -4 |
| 03/11/2028 | 77.71 | 10.42% | -5 |
| 26/02/2030 | 75.13 | 10.57% | -3 |
| 22/04/2031 | 75.92 | 10.61% | -4 |
| 23/03/2032 | 78.41 | 10.03% | -5 |
| 02/11/2035 | 75.38 | 10.16% | -3 |
| 23/03/2037 | 76.06 | 10.19% | -3 |
Lebanese Forex Market
| Last Price | Previous | % Change | Y-t-D | |
| $/LBP | 1,514.25 | 1,514.25 | – | |
| €/LBP | 1,681.31 | 1,682.37 | -0.06% | |
| £/LBP | 1,907.44 | 1,907.29 | 0.01% | |
| NEER | 119.85 | 119.60 | 0.21% |
Closing Date: 29 May 2019