Discover today’s performance of BLOM indices, the closing prices of Lebanese stocks and Eurobonds, as well as the exchange rate of major currencies against the LBP.
BLOM Stock Index (BSI) – today’s performance
| Last | Previous | % Change | Y-t-D Change | |
| BSI | 841.78 | 842.44 | -0.08% | -13.76% |
| High | 843.70 | 842.40 | ||
| Low | 841.40 | 839.30 | ` | |
| Volume | 359,442 | 32,285 | ||
| Val ($) | 1,894,690 | 193,661 |
I): BLOM preferred Shares Index (BPSI): today’s Performance
| Last | Previous | Change | |
| BPSI | 84.87 | 84.87 | 0.00% |
| Volume | – | – | |
| Value | – | – |
Lebanese Stocks: today’s Trades and Closing Prices
| Last Price ($) | % Change | Volume | VWAP ($) | |
| Solidere A | 5.08 | 1.20% | 292,185 | 5.02 |
| Solidere B | 5.18 | 0.97% | 37,470 | 4.98 |
| Bank of Beirut- Listed shares | 18.8 | 0.00% | 502 | 18.8 |
| BLOM Bank – Listed | 8 | -0.99% | 20,000 | 8 |
| BLOM GDR | 7.7 | 0.26% | 9,285 | 7.7 |
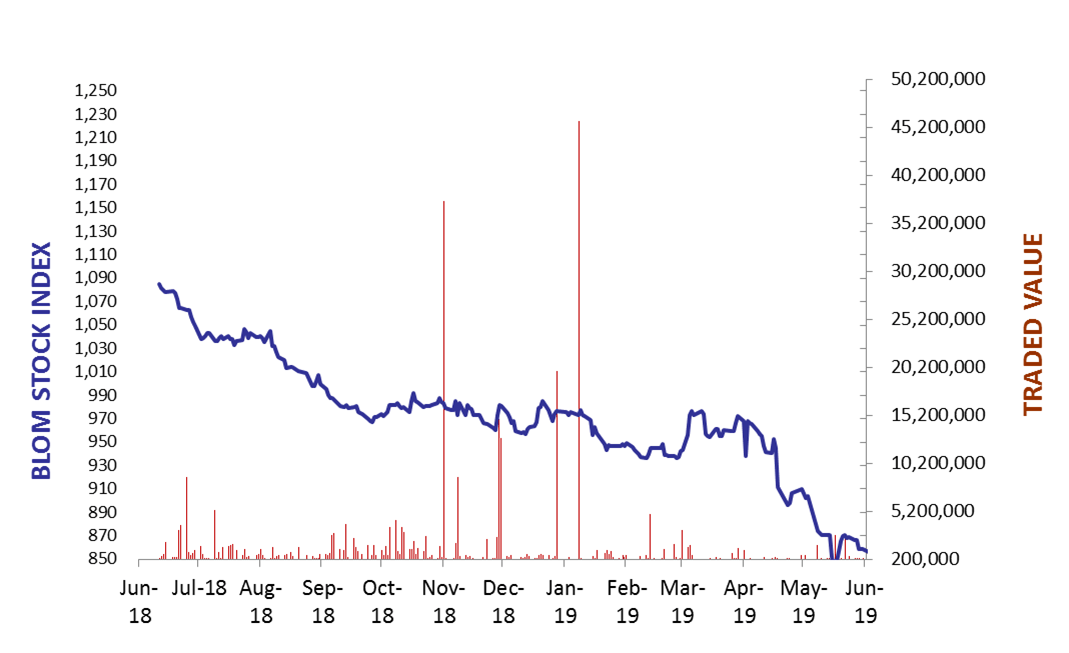
The BLOM Stock Index
Lebanese Global Depository Receipts: Last session’s Performance
| GDRs | Last Price ($) | Previous Price ($) | % Change | Volume | Value ($) |
| BLOM GDR | 7.65 | 7.8 | -1.92% | 377 | 2,885 |
| Audi GDR | 4 | 4 | 0.00% | ||
| Byblos GDR | 77 | 77 | 0.00% | – | – |
Closing Date: 10 June 2019
Source: London Stock Exchange
BLOM BOND INDEX: Last Session’s Performance
| Last | Previous | Change | Y-t-D Change | ||
| BBI | 88.41 | 88.38 | 0.04% | -12.52% | |
| Weighted Yield | 11.16% | 11.15% | 0 | bps | |
| Duration (Years) | 5.17 | 5.18 | |||
| 5Y Bond Yield | 11.80% | 11.75% | 5 | bps | |
| 5Y Spread* | 993 | 993 | 0 | bps | |
| 10Y Bond Yield | 11.10% | 11.06% | 4 | bps | |
| 10Y Spread* | 907 | 909 | -2 | bps | |
*between Lebanese Eurobonds and US Treasuries
Closing Date: 10 June 2019
Lebanese Eurobonds: Last Sessions’ Prices and Yields
| Price | Yield | Yield Change | |
| 12/04/2021 | 94.38 | 11.72% | 8 |
| 04/10/2022 | 84.94 | 11.70% | 2 |
| 27/01/2023 | 83.26 | 11.79% | -2 |
| 22/04/2024 | 81.43 | 11.77% | -7 |
| 04/11/2024 | 79.36 | 11.48% | -1 |
| 03/12/2024 | 81.72 | 11.60% | -4 |
| 26/02/2025 | 78.86 | 11.32% | -2 |
| 12/06/2025 | 79.63 | 10.97% | 1 |
| 28/11/2026 | 78.03 | 10.99% | 5 |
| 23/03/2027 | 78.01 | 11.14% | -2 |
| 29/11/2027 | 76.70 | 11.06% | 1 |
| 03/11/2028 | 76.40 | 10.69% | 0 |
| 26/02/2030 | 74.35 | 10.73% | -5 |
| 22/04/2031 | 74.88 | 10.80% | -8 |
| 23/03/2032 | 77.15 | 10.24% | -2 |
| 02/11/2035 | 74.54 | 10.30% | 0 |
| 23/03/2037 | 75.18 | 10.32% | 1 |
Lebanese Forex Market
| Last Price | Previous | % Change | Y-t-D | |
| $/LBP | 1,514.25 | 1,514.25 | – | |
| €/LBP | 1,705.43 | 1,705.28 | 0.01% | |
| £/LBP | 1,916.64 | 1,912.26 | 0.23% | |
| NEER | 118.61 | 118.69 | -0.07% |
Closing Date: 11 June 2019