
Lebanon’s trade deficit tightened by 25.91% year-on-year (y-o-y) to $3.43B in Q1 2015 compared to $4.62B in the same period the year before. This was mainly due to the decline in the price of oil and the depreciating of the Euro, which led to a 22.72% decline in overall imports outpacing the 3.62% fall in total exports.
Total imports, in the first three months of the year, reached $4.17B compared to $5.40B in Q1 2014.
In specific, the three major imported product categories by March were mineral products (17.76% share of total imports), “products of the chemical or allied industries” (11.74% share of total imports) and “machinery and electrical instruments” (11.15% share of total imports). Imported mineral products experienced a massive 49.25% yearly decline from March 2014. With an inelastic demand, this contraction went parallel with the average 49.17% decrease in the price of international oil since March last year. In addition, “products of the chemical or allied industries” and “machinery and electrical instruments” downturned by 6.60% and 18.41% y-o-y, respectively. Both saw a weakening in demand, as the respective total tonnage imported fell by 7.19% and 5.87% to 137 tons and 57 tons. Furthermore, the prices of the former imports fell with the depreciating Euro, as they were mostly brought in from Germany and France. Prices of “machinery and electrical instruments” dropped with China selling about 30% of those goods to Lebanon. Notably, the three major countries that Lebanon imports goods from were China, Italy and Germany with corresponding weights of 12.29%, 6.68% and 6.40%.
Similarly, total exports fell annually by 3.62% to $743.83M by March 2015 despite the 7.78% y-o-y increase in volume of overall exports to 471 tons.
Specifically, “pearls, precious stones, and metals”, constituting 16.18% of total exports, went down by 16.00% y-o-y due to the average 6.11% fall of international gold quote to 1,183.97 $/ounce by March 31, 2015. Furthermore, exported “prepared foodstuffs, beverages, and tobacco” (15.99% share of total exports) experienced a yearly detraction of 7.00% in Q1 2015, despite the 5.64% rise in exported volume to 95 tons. This might be due to the falling global trend in prices of “off the shelf items” (prepared food stuffs, beverages & tobacco). “Machinery and electrical instruments” (13.55% share of total exports) experienced a 1.90% y-o-y downtick in the value of exports in response to the rise in local prices, as the volume went down by 19.48% yearly to 15 tons in Q1 2015. In terms of the major destinations of the Lebanese exports, Saudi Arabia, United Arab Emirates and Iraq seized respective weights of 13.20%, 10.47% and 8.36%.
On a monthly basis, total exports and imports lessened by 6.39% and 15.76% respectively from March 2014. Consequently, the trade deficit contracted from $1.52B to $1.25B in March 2015.
Lebanon Imports/Exports in Q1 (in $B)
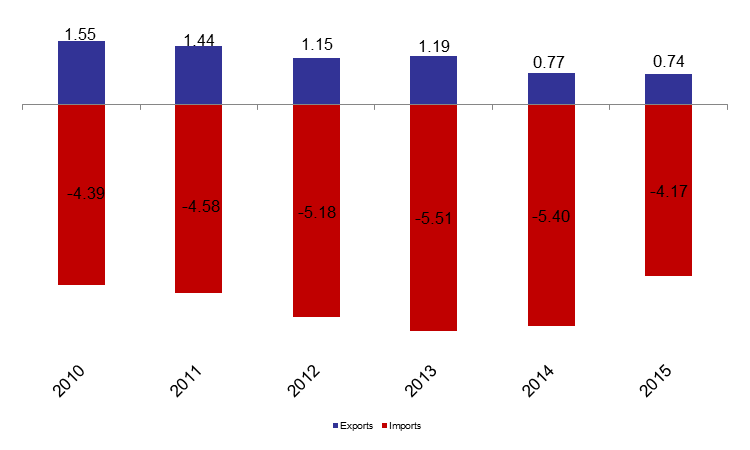
Source: Customs