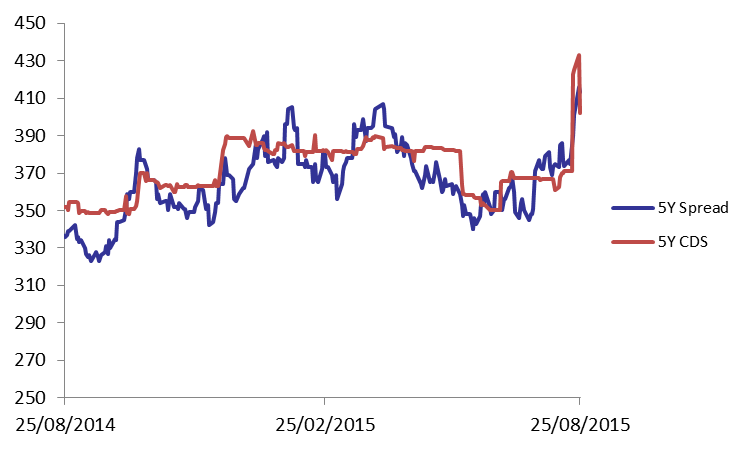
The improvement of demand for short term Lebanese Eurobonds failed to boost the market on Tuesday as appetite for medium and long term maturities significantly dropped. Accordingly, the BLOM BOND INDEX (BBI) lost by 0.44% to 105.69 points, its lowest level since February 2, 2014. Yields on the 5Y and 10Y Lebanese Eurobonds increased by 6 basis points (bps) and 16 bps to reach respective levels of 5.61% and 6.52%. The downturn in demand for U.S. notes, following 5 consecutive positive sessions, stood behind the 3bps tightening of the 5Y spread between Lebanese Eurobonds and their US counterpart to 413 bps. The Lebanese 5Y Credit Default Swaps (CDS) tightened from their previous quotes of 418-448 bps to 388-415 bps.
| Last | Previous | Change | Y-t-D Change | ||
| BBI | 105.687 | 106.158 | -0.44% | -1.66% | |
| Weighted Yield | 5.72% | 5.67% | 9 | bps | |
| Duration (Years) | 5.00 | 5.01 | |||
| 5Y Bond Yield | 5.61% | 5.55% | 6 | bps | |
| 5Y Spread* | 413 | 416 | -3 | bps | |
| 10Y Bond Yield | 6.52% | 6.36% | 16 | bps | |
| 10Y Spread* | 440 | 435 | 5 | bps | |
*Between Lebanese and U.S notes
| Price | Yield | Yield Change (in bps) | |
| Nov. 2016 | 100.79 | 4.06% | 1 |
| Mar. 2017 | 106.87 | 4.42% | -24 |
| Oct. 2017 | 100.9 | 4.55% | -7 |
| Jun. 2018 | 101.15 | 4.70% | -15 |
| Nov. 2018 | 100.87 | 4.85% | -13 |
| Apr. 2019 | 100.25 | 5.42% | 45 |
| Mar. 2020 | 102.75 | 5.68% | 6 |
| Apr. 2020 | 100.5 | 5.67% | 6 |
| Apr. 2021 | 110.75 | 5.97% | 5 |
| Oct. 2022 | 100.25 | 6.05% | 9 |
| Jan. 2023 | 99.5 | 6.08% | 8 |
| Dec. 2024 | 105.25 | 6.24% | 10 |
| Feb. 2025 | 99.75 | 6.24% | 11 |
| Nov. 2026 | 100 | 6.60% | 19 |
| Nov. 2027 | 100.75 | 6.66% | 21 |
| Feb. 2030 | 100 | 6.65% | 11 |