
Discover today’s performance of BLOM indices, the closing prices of Lebanese stocks and Eurobonds, as well as the exchange rate of major currencies against the LBP.
BLOM Stock Index (BSI): Today’s Performance
| Last | Previous | % Change | Y-t-D Change | |
| BSI | 1,174.54 | 1,191.52 | -1.43% | -3.15% |
| High | 1,190.77 | 1,215.65 | ||
| Low | 1,173.80 | 1,190.32 | ||
| Volume | 312,897 | 189,810 | 64.85% | |
| Val ($) | 2,671,161 | 1,757,323 | 52.00% |
BLOM Preferred Shares Index (BPSI): Today’s Performance
| Last | Previous | Change | |
| BPSI | 106.23 | 106.28 | -0.05% |
| Volume | 11,675 | 11,380 | |
| Value | 1,045,568 | 298,725 |
Lebanese Stocks: Today’s Trades and Closing Prices
| Last Price ($) | % Change | Volume | Value | VWAP ($) | |
| Solidere A | 8.35 | -3.91% | 73,843 | 620,566 | 8.40 |
| Solidere B | 8.31 | -3.93% | 20,367 | 171,263 | 8.41 |
| Audi Listed | 6.50 | -2.99% | 35,000 | 227,500 | 6.50 |
| Audi GDR | 6.24 | -6.17% | 16,143 | 100,772 | 6.24 |
| BoB Preferred I | 26.25 | – | 2,050 | 53,813 | 26.25 |
| Byblos Listed | 1.75 | 2.34% | 132,000 | 230,900 | 1.75 |
| Byblos Preferred 2008 | 103.10 | 0.10% | 3,800 | 391,780 | 103.10 |
| Byblos Preferred 2009 | 103.00 | -48.00% | 5,825 | 599,975 | 103.00 |
| BLOM Listed | 11.00 | – | 5,490 | 60,390 | 11.00 |
| BLOM GDRs | 11.69 | -0.51% | 16,100 | 187,820 | 11.67 |
| HOLCIM | 11.58 | -1.11% | 2,279 | 26,382 | 11.58 |
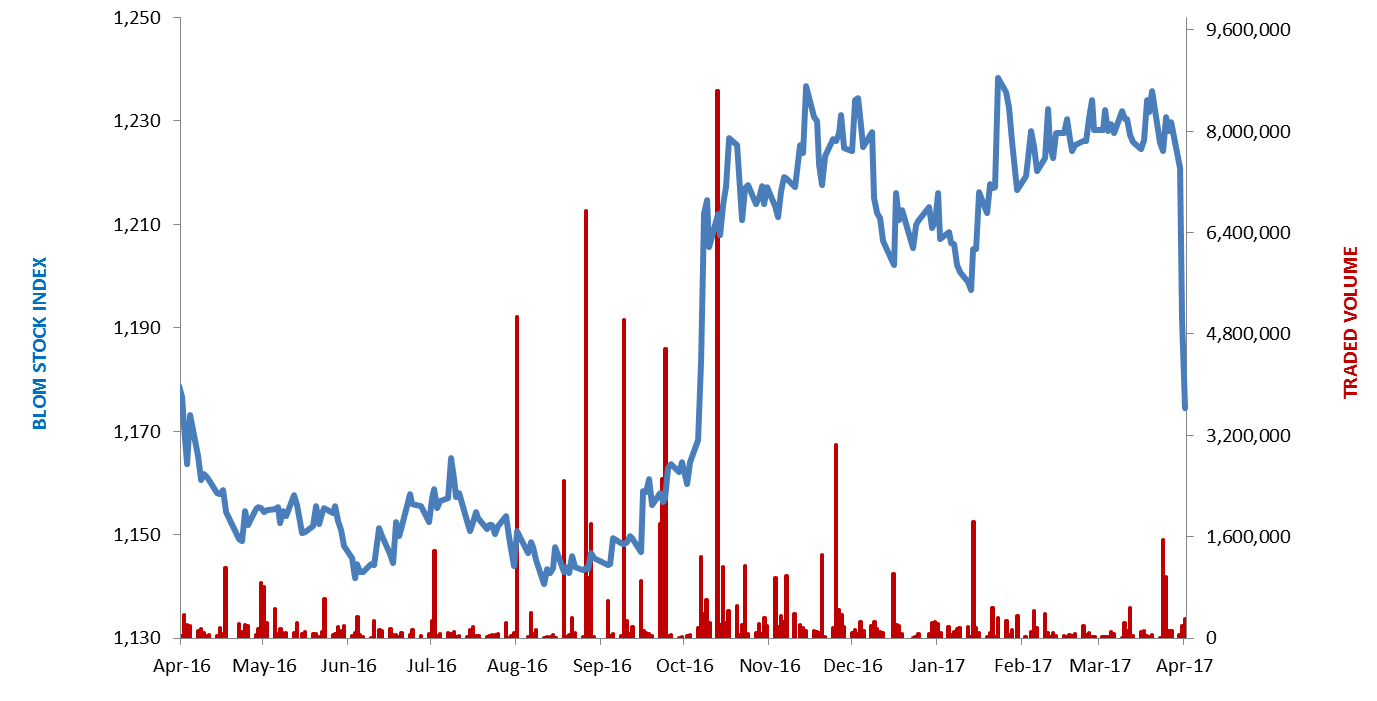
The BLOM Stock Index
Lebanese Global Depository Receipts: Last session’s Performance
| GDRs | Last Price ($) | Previous Price ($) | % Change | Volume | Value ($) |
| BLOM GDR | 11.75 | 12.45 | -5.62% | 14,604 | 171,597 |
| Audi GDR | 6.75 | 6.75 | – | – | – |
| Byblos GDR | 82.00 | 82.00 | – | – | – |
| Solidere GDR | 8.70 | 8.60 | 1.16% | 6,987 | 60,787 |
Source: Reuters
Closing Date: 11 April 2017
BLOM BOND INDEX: Last Session’s Performance
| Last | Previous | Change | Y-t-D Change | ||
| BBI | 106.773 | 106.860 | -0.081% | 4.78% | |
| Weighted Yield | 5.70% | 5.68% | 2.04 | bps | |
| Duration (Years) | 5.40 | 5.41 | |||
| 5Y Bond Yield | 5.38% | 5.35% | 3 | bps | |
| 5Y Spread* | 354 | 344 | 10 | bps | |
| 10Y Bond Yield | 6.45% | 6.44% | 1 | bps | |
| 10Y Spread* | 413 | 407 | 6 | bps | |
*between Lebanese Eurobonds and US Treasuries
Closing Date: 11 April 2017
Lebanese Eurobonds: Last Sessions’ Prices and Yields
| Price | Yield | Yield Change | |
| 12/06/2018 | 101.38 | 3.93% | 0 |
| 12/11/2018 | 101.50 | 4.16% | 0 |
| 23/04/2019 | 101.88 | 4.52% | 6 |
| 20/05/2019 | 102.88 | 4.55% | 6 |
| 28/11/2019 | 102.00 | 4.63% | 5 |
| 09/03/2020 | 104.25 | 4.79% | 9 |
| 14/04/2020 | 102.50 | 4.90% | 0 |
| 19/06/2020 | 103.38 | 4.99% | -4 |
| 12/04/2021 | 110.75 | 5.24% | 6 |
| 04/10/2022 | 103.00 | 5.46% | 0 |
| 27/01/2023 | 101.88 | 5.61% | 2 |
| 22/04/2024 | 103.00 | 6.12% | 0 |
| 04/11/2024 | 100.50 | 6.17% | 0 |
| 03/12/2024 | 104.88 | 6.19% | 2 |
| 26/02/2025 | 100.00 | 6.20% | 0 |
| 12/06/2025 | 100.00 | 6.25% | 0 |
| 28/11/2026 | 101.50 | 6.39% | 2 |
| 23/03/2027 | 103.00 | 6.44% | 0 |
| 29/11/2027 | 101.63 | 6.53% | 3 |
| 03/11/2028 | 100.25 | 6.62% | 0 |
| 26/02/2030 | 100.00 | 6.65% | 0 |
| 22/04/2031 | 101.00 | 6.89% | 0 |
| 23/03/2032 | 102.00 | 6.78% | 1 |
| 02/11/2035 | 100.75 | 6.98% | 0 |
| 23/03/2037 | 102.00 | 7.06% | 1 |
| Last Price | Previous | % Change | Y-t-D | |
| $/LBP | 1,514.25 | 1,514.25 | – | |
| €/LBP | 1,600.97 | 1,598.25 | 0.17% | |
| £/LBP | 1,884.83 | 1,883.17 | 0.09% | |
| NEER | 117.37 | 117.57 | -0.17% | -0.87% |
Closing Date: 12 April 2017