
Discover today’s performance of BLOM indices, the closing prices of Lebanese stocks and Eurobonds, as well as the exchange rate of major currencies against the LBP.
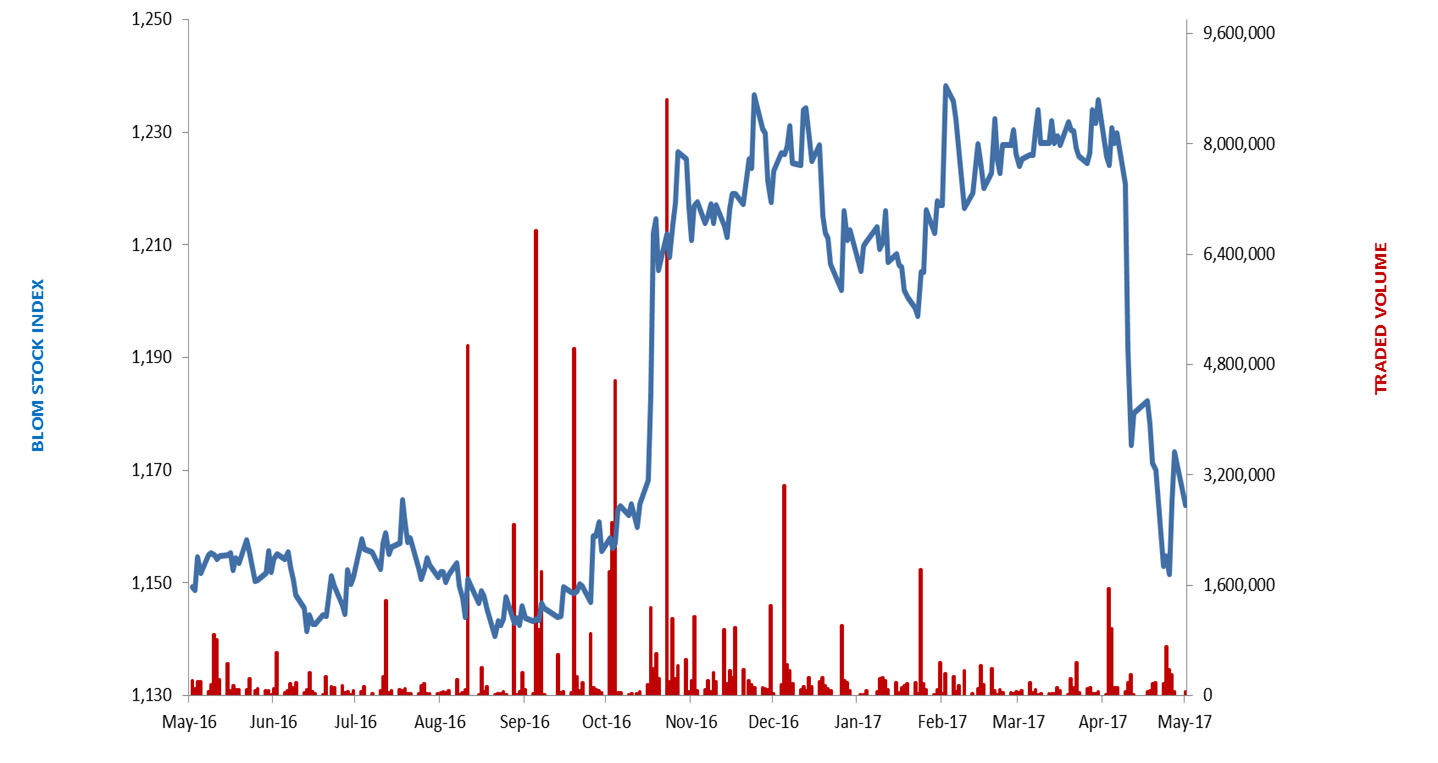
BLOM Stock Index (BSI): Today’s Performance
| Last | Previous | % Change | Y-t-D Change | |
| BSI | 1,163.85 | 1,171.36 | -0.64% | -4.03% |
| High | 1,170.95 | 1,172.20 | ||
| Low | 1,151.59 | 1,169.31 | ||
| Volume | 56,049 | 56,233 | -0.33% | |
| Val ($) | 665,737 | 270,248 | 146.34% |
BLOM Preferred Shares Index (BPSI): Today’s Performance
| Last | Previous | Change | |
| BPSI | 105.55 | 105.89 | -0.32% |
| Volume | 2,000 | – | |
| Value | 200,000 | – |
Lebanese Stocks: Today’s Trades and Closing Prices
| Last Price ($) | % Change | Volume | Value | VWAP ($) | |
| Solidere A | 8.83 | 3.88% | 21,984 | 198,783 | 9.04 |
| Solidere B | 8.82 | 3.76% | 4,203 | 37,060 | 8.82 |
| Bank Audi Listed | 6.30 | -0.79% | 1,050 | 6,615 | 6.30 |
| Bank Audi GDR | 6.35 | -1.70% | 3,900 | 24,750 | 6.35 |
| Byblos Bank Listed | 1.60 | -8.57% | 5,720 | 9,162 | 1.60 |
| Byblos Bank Pref 2008 | 100.00 | -3.01% | 2,000 | 200,000 | 100.00 |
| BLOM Bank Listed | 10.60 | -0.93% | 10,467 | 110,950 | 10.60 |
| BLOM Bank GDR | 11.66 | -0.34% | 6,725 | 78,417 | 11.66 |
The BLOM Stock Index
Lebanese Global Depository Receipts: Last session’s Performance
| GDRs | Last Price ($) | Previous Price ($) | % Change | Volume | Value ($) |
| BLOM GDR | 11.50 | 11.75 | -2.13% | 5,399 | 62,089 |
| Audi GDR | 6.50 | 6.50 | – | – | – |
| Byblos GDR | 82.00 | 82.00 | – | – | – |
| Solidere GDR | 8.80 | 8.70 | 1.15% | 15,237 | 134,086 |
Source: Reuters
Closing Date: 28 April 2017
BLOM BOND INDEX: Last Session’s Performance
| Last | Previous | Change | Y-t-D Change | ||
| BBI | 106.574 | 106.492 | 0.08% | 4.59% | |
| Weighted Yield | 5.725% | 5.745% | -2.02 | bps | |
| Duration (Years) | 5.38 | 5.38 | |||
| 5Y Bond Yield | 5.40% | 5.42% | -2 | bps | |
| 5Y Spread* | 359 | 361 | -2 | bps | |
| 10Y Bond Yield | 6.55% | 6.56% | -1 | bps | |
| 10Y Spread* | 426 | 426 | 0 | bps | |
*between Lebanese Eurobonds and US Treasuries
Closing Date: 28 April 2017
Lebanese Eurobonds: Last Sessions’ Prices and Yields
| Price | Yield | Yield Change | |
| 12/06/2018 | 101.25 | 4.00% | 0 |
| 12/11/2018 | 101.50 | 4.13% | 0 |
| 23/04/2019 | 101.88 | 4.50% | -7 |
| 20/05/2019 | 102.88 | 4.52% | -7 |
| 28/11/2019 | 102.00 | 4.62% | -5 |
| 09/03/2020 | 104.13 | 4.81% | -4.93 |
| 14/04/2020 | 102.30 | 4.95% | -2 |
| 19/06/2020 | 103.15 | 5.05% | -1 |
| 12/04/2021 | 110.75 | 5.21% | -3 |
| 04/10/2022 | 102.88 | 5.48% | -3 |
| 27/01/2023 | 102.13 | 5.56% | -3 |
| 22/04/2024 | 102.88 | 6.14% | 0 |
| 04/11/2024 | 100.25 | 6.21% | -2 |
| 03/12/2024 | 104.63 | 6.22% | -1 |
| 26/02/2025 | 99.75 | 6.24% | 0 |
| 12/06/2025 | 99.88 | 6.27% | -2 |
| 28/11/2026 | 101.00 | 6.46% | 0 |
| 23/03/2027 | 102.25 | 6.54% | -2 |
| 29/11/2027 | 101.13 | 6.60% | -2 |
| 03/11/2028 | 100.13 | 6.63% | 0 |
| 26/02/2030 | 100.00 | 6.65% | 0 |
| 22/04/2031 | 101.50 | 6.83% | 0 |
| 23/03/2032 | 101.50 | 6.84% | 0 |
| 02/11/2035 | 100.25 | 7.03% | -2 |
| 23/03/2037 | 101.38 | 7.12% | -1 |
| Last Price | Previous | % Change | Y-t-D | |
| $/LBP | 1,514.25 | 1,514.25 | – | |
| €/LBP | 1,645.29 | 1,642.87 | 0.15% | |
| £/LBP | 1,946.94 | 1,942.41 | 0.23% | |
| NEER | 115.75 | 115.57 | 0.15% | -2.24% |
Closing Date: 02 May 2017