
Discover today’s performance of BLOM indices, the closing prices of Lebanese stocks and Eurobonds, as well as the exchange rate of major currencies against the LBP.
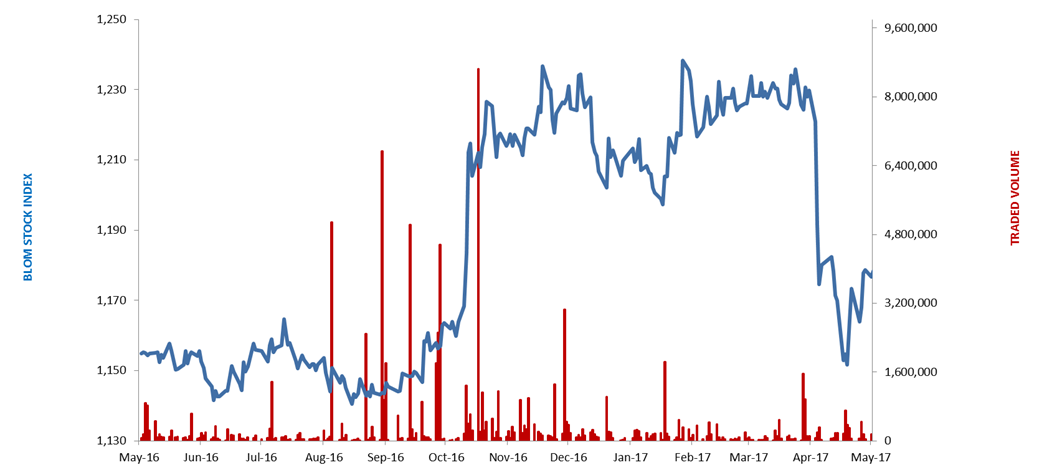
BLOM Stock Index (BSI): Today’s Performance
| Last | Previous | % Change | Y-t-D Change | |
| BSI | 1,178.31 | 1,176.68 | 0.14% | -2.84% |
| High | 1,180.75 | 1,182.36 | ||
| Low | 1,169.92 | 1,169.39 | ||
| Volume | 192,464 | 147,574 | 30.42% | |
| Val ($) | 3,215,144 | 2,535,612 | 26.80% |
BLOM Preferred Shares Index (BPSI): Today’s Performance
| Last | Previous | Change | |
| BPSI | 104.91 | 105.33 | -0.40% |
| Volume | 26,615 | 15,410 | |
| Value | 2,625,695 | 1,548,745 |
Lebanese Stocks: Today’s Trades and Closing Prices
| Last Price ($) | % Change | Volume | Value | VWAP ($) | |
| Solidere A | 9.41 | 3.97% | 15,906 | 147,130 | |
| Solidere B | 9.01 | 0.55% | 2,795 | 25,070 | |
| Bank Audi Pref G | 100.20 | 0.00% | 550 | 55,110 | |
| Bank Audi Pref I | 100.50 | 0.00% | 15,090 | 1,516,545 | |
| BOB Pref H | 25.15 | -4.19% | 600 | 15,090 | |
| Byblos Bank Listed | 1.62 | -1.81% | 128,740 | 208,599 | |
| Byblos Bank Pref 2008 | 100.30 | 0.00% | 3,000 | 300,900 | |
| Byblos Bank Pref 2009 | 100.20 | -0.79% | 7,375 | 738,050 | |
| BLOM Bank GDR | 11.70 | 0.08% | 11,600 | 135,720 | |
| BLOM Bank Listed | 10.71 | -0.09% | 6,805 | 72,894 | |
| HOLCIM Liban | 11.90 | 0.00% | 3 | 36.00 |
The BLOM Stock Index
Lebanese Global Depository Receipts: Last session’s Performance
| GDRs | Last Price ($) | Previous Price ($) | % Change | Volume | Value ($) |
| BLOM GDR | 11.70 | 11.70 | – | – | – |
| Audi GDR | 6.35 | 6.45 | -1.55% | 200,000 | 1,270,000 |
| Byblos GDR | 82.00 | 82.00 | – | – | – |
| Solidere GDR | 9.25 | 9.25 | – | 34,342 | 317,664 |
Source: Reuters
Closing Date: 8 May 2017
BLOM BOND INDEX: Last Session’s Performance
| Last | Previous | Change | Y-t-D Change | ||
| BBI | 106.468 | 106.571 | -0.10% | 4.48% | |
| Weighted Yield | 5.750% | 5.733% | 1.65 | bps | |
| Duration (Years) | 5.37 | 5.38 | |||
| 5Y Bond Yield | 5.43% | 5.39% | 4 | bps | |
| 5Y Spread* | 352 | 350 | 2 | bps | |
| 10Y Bond Yield | 6.56% | 6.54% | 2 | bps | |
| 10Y Spread* | 417 | 418 | -1 | bps | |
*between Lebanese Eurobonds and US Treasuries
Closing Date: 8 May 2017
Lebanese Eurobonds: Last Sessions’ Prices and Yields
| Price | Yield | Yield Change | |
| 12/06/2018 | 101.25 | 3.97% | -1 |
| 12/11/2018 | 101.50 | 4.12% | -1 |
| 23/04/2019 | 101.70 | 4.58% | 2 |
| 20/05/2019 | 102.70 | 4.59% | 2 |
| 28/11/2019 | 101.75 | 4.71% | 0 |
| 09/03/2020 | 103.75 | 4.94% | 0 |
| 14/04/2020 | 102.13 | 5.01% | 0 |
| 19/06/2020 | 103.00 | 5.09% | 0 |
| 12/04/2021 | 110.50 | 5.25% | 6 |
| 04/10/2022 | 102.75 | 5.50% | 3 |
| 27/01/2023 | 102.00 | 5.58% | 5 |
| 22/04/2024 | 103.00 | 6.11% | 2 |
| 04/11/2024 | 100.38 | 6.19% | 2 |
| 03/12/2024 | 104.65 | 6.22% | 4 |
| 26/02/2025 | 99.75 | 6.24% | 0 |
| 12/06/2025 | 99.75 | 6.29% | 0 |
| 28/11/2026 | 101.25 | 6.42% | 0 |
| 23/03/2027 | 102.13 | 6.55% | 2 |
| 29/11/2027 | 101.25 | 6.58% | 2 |
| 03/11/2028 | 100.25 | 6.62% | 3 |
| 26/02/2030 | 100.00 | 6.65% | 0 |
| 22/04/2031 | 101.25 | 6.86% | 3 |
| 23/03/2032 | 101.13 | 6.88% | 4 |
| 02/11/2035 | 100.25 | 7.03% | 0 |
| 23/03/2037 | 101.00 | 7.15% | 2 |
| Last Price | Previous | % Change | Y-t-D | |
| $/LBP | 1,514.25 | 1,514.25 | – | |
| €/LBP | 1,642.42 | 1,646.34 | -0.24% | |
| £/LBP | 1,949.05 | 1,950.40 | -0.07% | |
| NEER | 116.00 | 115.82 | 0.16% | -2.03% |
Closing Date: 9 May 2017