
Discover today’s performance of BLOM indices, the closing prices of Lebanese stocks and Eurobonds, as well as the exchange rate of major currencies against the LBP.
BLOM Stock Index (BSI): Today’s Performance
| Last | Previous | % Change | Y-t-D Change | |
| BSI | 1,174.05 | 1,175.50 | -0.12% | -3.19% |
| High | 1,175.84 | 1,178.31 | ||
| Low | 1,171.98 | 1,171.65 | ||
| Volume | 58,544 | 67,794 | -13.64% | |
| Val ($) | 698,394 | 842,951 | -17.15% |
BLOM Preferred Shares Index (BPSI): Today’s Performance
| Last | Previous | Change | |
| BPSI | 105.02 | 104.99 | 0.03% |
| Volume | 1,028 | 6,000 | |
| Value | 103,697 | 600,590 |
Lebanese Stocks: Today’s Trades and Closing Prices
| Last Price ($) | % Change | Volume | Value | VWAP ($) | |
| Solidere A | 9.15 | 0.55% | 24,941 | 227,821 | 9.13 |
| Solidere B | 9.06 | -1.41% | 4,873 | 44,134 | 9.06 |
| Byblos Bank Pref 2009 | 100.90 | 0.20% | 1,028 | 103,697 | 100.87 |
| BLOM Bank Listed | 10.70 | -0.56% | 3,420 | 36,594 | 10.70 |
| BLOM GDR | 11.70 | 0.00% | 14,040 | 164,268 | 11.70 |
| HOLCIM Liban | 11.90 | -0.42% | 10,242 | 121,880 | 11.90 |
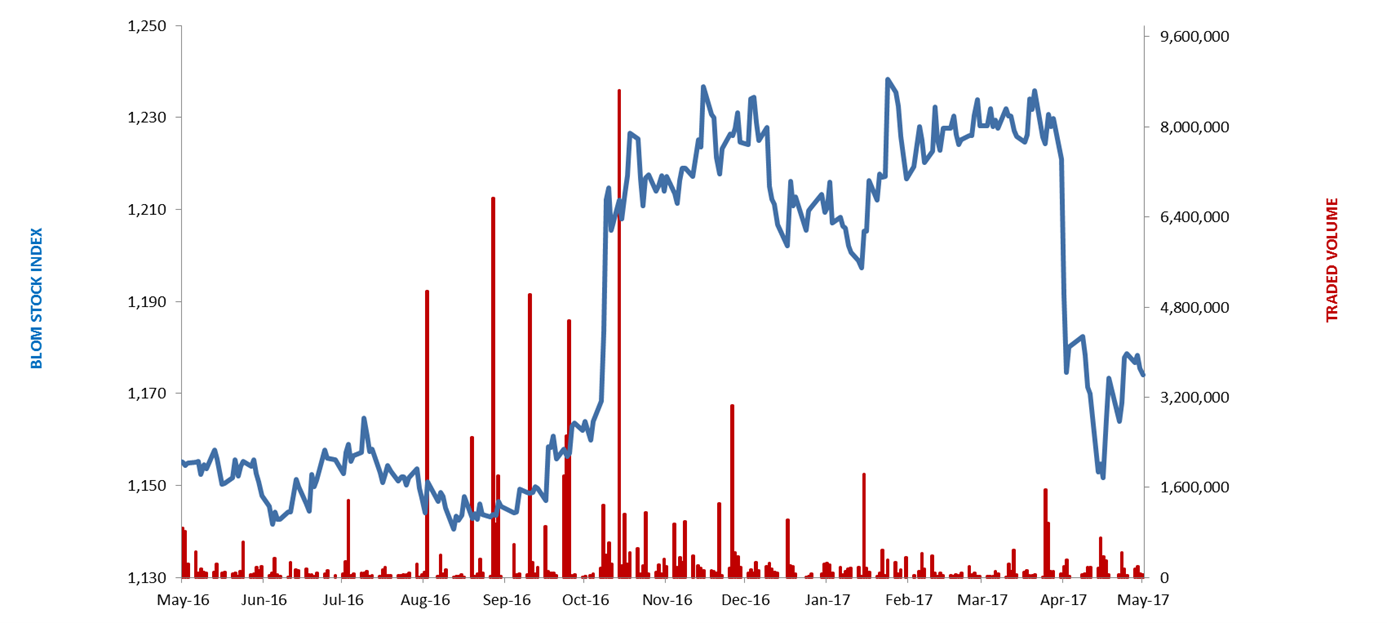
The BLOM Stock Index
Lebanese Global Depository Receipts: Last session’s Performance
| GDRs | Last Price ($) | Previous Price ($) | % Change | Volume | Value ($) |
| BLOM GDR | 11.70 | 11.70 | – | – | – |
| Audi GDR | 6.46 | 6.35 | 1.73% | 11,961 | 77,268 |
| Byblos GDR | 82.00 | 82.00 | – | – | – |
| Solidere GDR | 9.57 | 9.25 | 3.46% | 731 | 6,996 |
Source: Reuters
Closing Date: 10 May 2017
BLOM BOND INDEX: Last Session’s Performance
| Last | Previous | Change | Y-t-D Change | ||
| BBI | 106.424 | 106.465 | -0.04% | 4.44% | |
| Weighted Yield | 5.773% | 5.753% | 2.09 | bps | |
| Duration (Years) | 5.36 | 5.37 | |||
| 5Y Bond Yield | 5.48% | 5.44% | 4 | bps | |
| 5Y Spread* | 354 | 350 | 4 | bps | |
| 10Y Bond Yield | 6.53% | 6.54% | -1 | bps | |
| 10Y Spread* | 412 | 412 | -1 | bps | |
*between Lebanese Eurobonds and US Treasuries
Closing Date: 10 May 2017
Lebanese Eurobonds: Last Sessions’ Prices and Yields
| Price | Yield | Yield Change | |
| 12/06/2018 | 101.25 | 3.96% | 0 |
| 12/11/2018 | 101.50 | 4.11% | 0 |
| 23/04/2019 | 101.50 | 4.69% | 7 |
| 20/05/2019 | 102.50 | 4.69% | 7 |
| 28/11/2019 | 101.50 | 4.82% | 6 |
| 09/03/2020 | 103.50 | 5.03% | 9 |
| 14/04/2020 | 101.75 | 5.15% | 14 |
| 19/06/2020 | 102.75 | 5.18% | 9 |
| 12/04/2021 | 110.25 | 5.32% | 7 |
| 04/10/2022 | 102.50 | 5.56% | 3 |
| 27/01/2023 | 101.88 | 5.61% | 2 |
| 22/04/2024 | 103.25 | 6.07% | -4 |
| 04/11/2024 | 100.75 | 6.12% | -6 |
| 03/12/2024 | 105.00 | 6.16% | -4 |
| 26/02/2025 | 100.00 | 6.20% | -2 |
| 12/06/2025 | 100.00 | 6.25% | 0 |
| 28/11/2026 | 101.25 | 6.42% | 0 |
| 23/03/2027 | 102.38 | 6.52% | -2 |
| 29/11/2027 | 101.50 | 6.55% | -2 |
| 03/11/2028 | 100.38 | 6.60% | 0 |
| 26/02/2030 | 99.88 | 6.66% | -2 |
| 22/04/2031 | 101.25 | 6.86% | 0 |
| 23/03/2032 | 101.13 | 6.88% | 0 |
| 02/11/2035 | 100.25 | 7.03% | 0 |
| 23/03/2037 | 101.13 | 7.14% | -1 |
| Last Price | Previous | % Change | Y-t-D | |
| $/LBP | 1,514.25 | 1,514.25 | – | |
| €/LBP | 1,638.95 | 1,638.05 | 0.06% | |
| £/LBP | 1,947.69 | 1,950.10 | -0.12% | |
| NEER | 115.97 | 115.82 | 0.13% | -2.06% |
Closing Date: 11 May 2017