
Discover today’s performance of BLOM indices, the closing prices of Lebanese stocks and Eurobonds, as well as the exchange rate of major currencies against the LBP.
BLOM Stock Index (BSI): Today’s Performance
| Last | Previous | % Change | Y-t-D Change | |
| BSI | 1,169.55 | 1,169.80 | -0.02% | -3.56% |
| High | 1,171.20 | 1,173.16 | ||
| Low | 1,168.92 | 1,166.52 | ||
| Volume | 57,504 | 200,950 | -71.38% | |
| Val ($) | 672,444 | 2,525,503 | -73.37% |
BLOM Preferred Shares Index (BPSI): Today’s Performance
| Last | Previous | Change | |
| BPSI | 104.74 | 104.73 | 0.01% |
| Volume | 2,034 | 10,700 | |
| Value | 114,039 | 1,083,440 |
Lebanese Stocks: Today’s Trades and Closing Prices
| Last Price ($) | % Change | Volume | VWAP ($) | |
| Solidere A | 8.84 | -1.34% | 6,740 | 8.89 |
| Bank Audi GDR | 6.20 | 0.00% | 14,000 | 6.20 |
| Bank Audi Pref H | 100.50 | 0.00% | 750 | 100.50 |
| Bank of Beirut Pref K | 25.15 | 0.00% | 1,200 | 25.15 |
| Byblos Bank – Listed | 1.62 | 0.62% | 250 | 1.62 |
| Byblos Bank Pref 2009 | 101.00 | 0.00% | 84 | 101.00 |
| Blom Listed | 11.08 | 0.27% | 5,780 | 11.08 |
| Blom GDR | 12.10 | 0.83% | 28,700 | 12.10 |
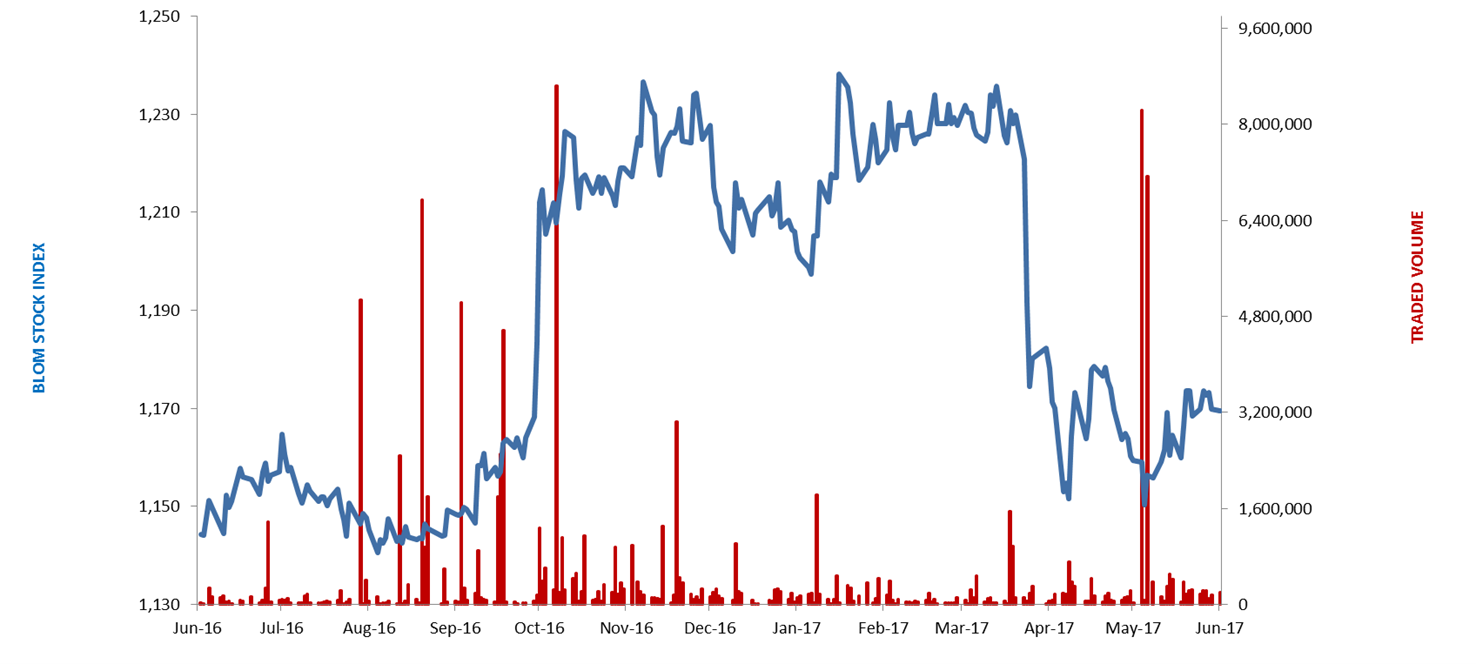
The BLOM Stock Index
Lebanese Global Depository Receipts: Last session’s Performance
| GDRs | Last Price ($) | Previous Price ($) | % Change | Volume | Value ($) |
| BLOM GDR | 11.9 | 11.9 | 0.0% | – | – |
| Audi GDR | 6 | 6.1 | -1.6% | 34,184 | 206,992 |
| Byblos GDR | 80 | 80 | 0.0% | – | – |
| Solidere GDR | 8.67 | 9.19 | -5.7% | 3,902 | 33,338 |
Closing Date: 16 June 2017
BLOM BOND INDEX: Last Session’s Performance
| Last | Previous | Change | Y-t-D Change | ||
| BBI | 105.95 | 105.56 | 0.37% | 3.97% | |
| Weighted Yield | 5.903% | 5.987% | -8.40 | bps | |
| Duration (Years) | 5.31 | 5.31 | |||
| 5Y Bond Yield | 5.69% | 5.78% | -9 | bps | |
| 5Y Spread* | 393 | 404 | -11 | bps | |
| 10Y Bond Yield | 6.56% | 6.64% | -8 | bps | |
| 10Y Spread* | 440 | 449 | -9 | bps | |
*between Lebanese Eurobonds and US Treasuries
Closing Date: 16 June 2017
Lebanese Eurobonds: Last Sessions’ Prices and Yields
| Price | Yield | Yield Change | |
| 12/06/2018 | 100.75 | 4.37% | 0 |
| 12/11/2018 | 101.00 | 4.41% | 0 |
| 23/04/2019 | 101.00 | 4.92% | 7 |
| 20/05/2019 | 101.88 | 4.96% | 6 |
| 28/11/2019 | 100.88 | 5.06% | 5 |
| 09/03/2020 | 102.63 | 5.32% | 5 |
| 14/04/2020 | 101.13 | 5.36% | 5 |
| 19/06/2020 | 102.00 | 5.42% | 5 |
| 12/04/2021 | 109.13 | 5.56% | 3 |
| 04/10/2022 | 101.50 | 5.77% | 3 |
| 27/01/2023 | 100.38 | 5.92% | 3 |
| 22/04/2024 | 102.38 | 6.22% | 0 |
| 04/11/2024 | 100.00 | 6.25% | 0 |
| 03/12/2024 | 104.38 | 6.26% | 0 |
| 26/02/2025 | 99.50 | 6.28% | 0 |
| 12/06/2025 | 99.63 | 6.31% | 0 |
| 28/11/2026 | 101.25 | 6.42% | 0 |
| 23/03/2027 | 102.00 | 6.57% | 2 |
| 29/11/2027 | 101.00 | 6.62% | 3 |
| 03/11/2028 | 99.88 | 6.66% | 2 |
| 26/02/2030 | 99.50 | 6.71% | 2 |
| 22/04/2031 | 101.50 | 6.83% | 0 |
| 23/03/2032 | 101.50 | 6.84% | 0 |
| 02/11/2035 | 100.50 | 7.00% | 0 |
| 23/03/2037 | 101.75 | 7.08% | 0 |
| Last Price | Previous | % Change | Y-t-D | |
| $/LBP | 1,514.00 | 1,514.25 | -0.02% | |
| €/LBP | 1,684.33 | 1,686.89 | -0.15% | |
| £/LBP | 1,924.32 | 1,925.68 | -0.07% | |
| NEER | 114.42 | 114.35 | 0.06% | -3.36% |
Closing Date: 19 June 2017