
Discover today’s performance of BLOM indices, the closing prices of Lebanese stocks and Eurobonds, as well as the exchange rate of major currencies against the LBP.
BLOM Stock Index (BSI): Today’s Performance
| Last | Previous | % Change | Y-t-D Change | |
| BSI | 1,145.02 | 1,151.19 | -0.54% | -5.58% |
| High | 1,153.22 | 1,153.22 | ||
| Low | 1,132.84 | 1,132.84 | ||
| Volume | 344,386.00 | 340,373.00 | 1.18% | |
| Val ($) | 3,079,996.00 | 3,644,388.00 | -15.49% |
BLOM Preferred Shares Index (BPSI): Today’s Performance
| Last | Previous | Change | |
| BPSI | 104.74 | 104.74 | 0.00% |
| Volume | 7,970 | 48,938 | |
| Value | 227,475 | 1,237,050 |
Lebanese Stocks: Today’s Trades and Closing Prices
| Last Price ($) | % Change | Volume | VWAP ($) | |
| Solidere A | 7.53 | -1.83% | 153,183 | 7.51 |
| Solidere B | 7.29 | -3.44% | 29,147 | 7.18 |
| Bank Audi GDR | 6.00 | -2.44% | 2,000 | 6.00 |
| Bank Audi Pref G | 100.20 | 0.00% | 350 | 100.20 |
| Bank of Beirut Pref I | 25.25 | 0.00% | 7,620 | 25.25 |
| Byblos Bank Listed | 1.63 | 0.00% | 247 | 1.63 |
| BEMO Listed | 1.64 | -3.33% | 25,000 | 1.64 |
| BLOM Bank Listed | 11.25 | 0.00% | 114,220 | 11.25 |
| BLOM GDR | 12.21 | 0.08% | 12,619 | 12.21 |
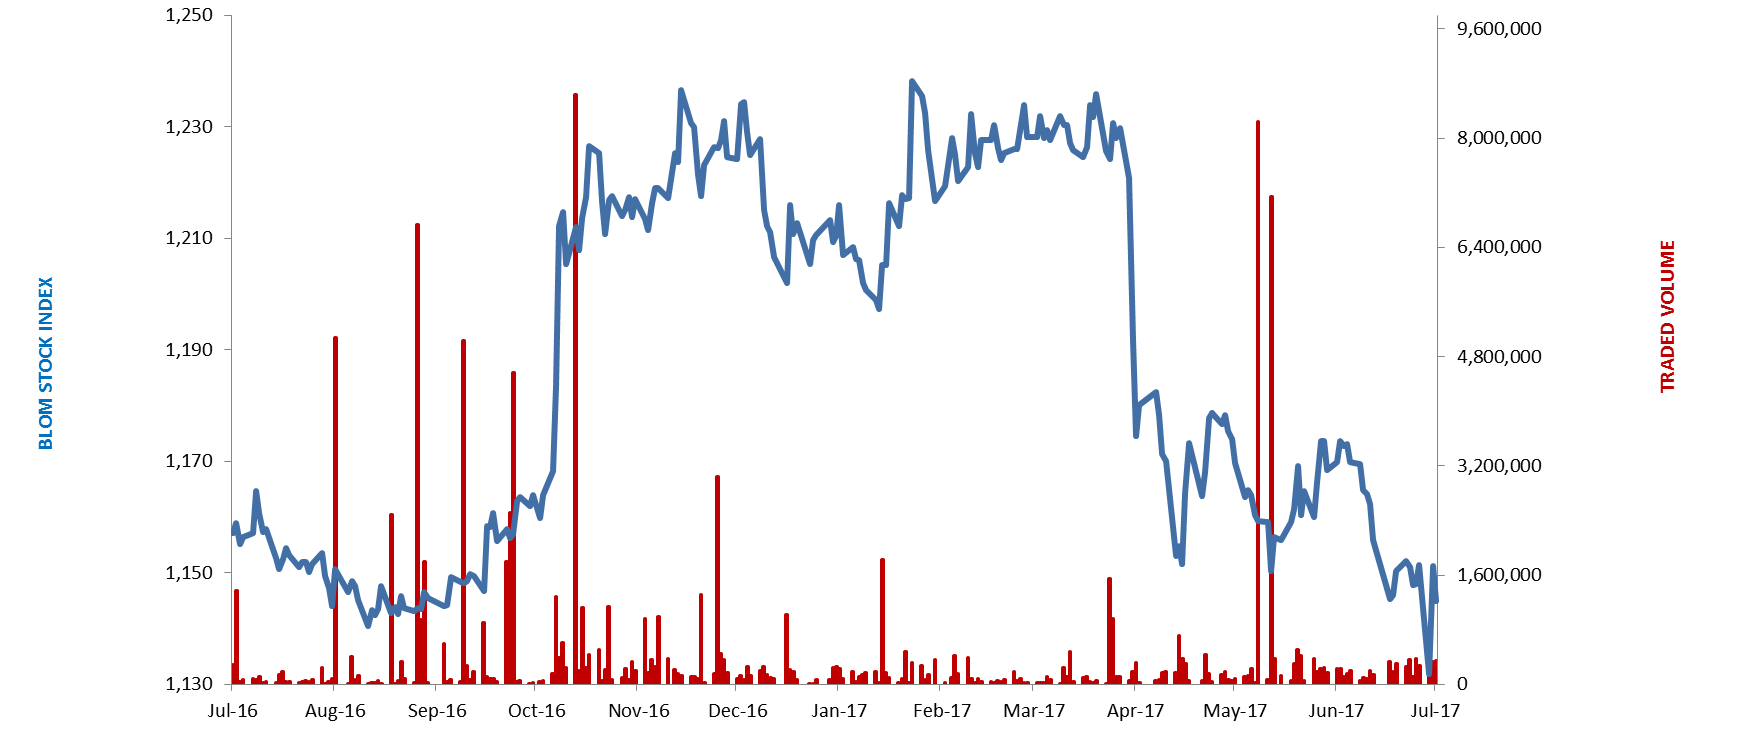
The BLOM Stock Index
Lebanese Global Depository Receipts: Last session’s Performance
| GDRs | Last Price ($) | Previous Price ($) | % Change | Volume | Value ($) |
| BLOM GDR | 12.1 | 12.2 | -0.8% | 2,020 | 24,387 |
| Audi GDR | 6 | 6 | 0.0% | – | – |
| Byblos GDR | 80 | 80 | 0.0% | – | – |
Source: London Stock Exchange
Closing Date: 11 July 2017
BLOM BOND INDEX: Last Session’s Performance
| Last | Previous | Change | Y-t-D Change | ||
| BBI | 103.71 | 103.63 | 0.08% | 1.77% | |
| Weighted Yield | 6.387% | 6.407% | -1.97 | bps | |
| Duration (Years) | 5.21 | 5.21 | |||
| 5Y Bond Yield | 6.25% | 6.32% | -7 | bps | |
| 5Y Spread* | 433 | 439 | -6 | bps | |
| 10Y Bond Yield | 6.92% | 6.95% | -4 | bps | |
| 10Y Spread* | 455 | 457 | -3 | bps | |
*between Lebanese Eurobonds and US Treasuries
Closing Date: 11 July 2017
Lebanese Eurobonds: Last Sessions’ Prices and Yields
| Price | Yield | Yield Change | |
| 12/06/2018 | 100.25 | 4.86% | 0 |
| 12/11/2018 | 100.25 | 4.95% | -9 |
| 23/04/2019 | 99.75 | 5.64% | 0 |
| 20/05/2019 | 100.63 | 5.63% | 0 |
| 28/11/2019 | 99.38 | 5.73% | 0 |
| 09/03/2020 | 101.00 | 5.96% | 0 |
| 14/04/2020 | 99.50 | 6.00% | 0 |
| 19/06/2020 | 100.25 | 6.05% | 0 |
| 12/04/2021 | 106.88 | 6.16% | 0 |
| 04/10/2022 | 99.00 | 6.32% | -3 |
| 27/01/2023 | 98.25 | 6.38% | -3 |
| 22/04/2024 | 100.50 | 6.56% | 0 |
| 04/11/2024 | 98.13 | 6.57% | -2 |
| 03/12/2024 | 102.38 | 6.59% | -3 |
| 26/02/2025 | 97.50 | 6.62% | -2 |
| 12/06/2025 | 97.63 | 6.64% | -4 |
| 28/11/2026 | 98.50 | 6.82% | 0 |
| 23/03/2027 | 99.63 | 6.90% | -4 |
| 29/11/2027 | 98.63 | 6.94% | -3 |
| 03/11/2028 | 97.50 | 6.97% | -2 |
| 26/02/2030 | 96.75 | 7.04% | -1 |
| 22/04/2031 | 99.13 | 7.10% | 0 |
| 23/03/2032 | 98.75 | 7.14% | -1 |
| 02/11/2035 | 98.00 | 7.25% | 0 |
| 23/03/2037 | 98.75 | 7.37% | 0 |
| Last Price | Previous | % Change | Y-t-D | |
| $/LBP | 1,514.00 | 1,514.00 | – | |
| €/LBP | 2,184.37 | 1,728.80 | 26.35% | |
| £/LBP | 1,938.65 | 1,933.22 | 0.28% | |
| NEER | 113.66 | 114.03 | -0.32% | -4.01% |
Closing Date: 12 July 2017