
Discover today’s performance of BLOM indices, the closing prices of Lebanese stocks and Eurobonds, as well as the exchange rate of major currencies against the LBP.
BLOM Stock Index (BSI): Today’s Performance
| Last | Previous | % Change | Y-t-D Change | |
| BSI | 1,154.58 | 1,168.21 | -1.17% | -4.79% |
| High | 1,155.00 | 1,170.61 | ||
| Low | 1,153.00 | 1,163.14 | ||
| Volume | 171,719 | 1,130,344 | -84.81% | |
| Val ($) | 2,193,439 | 9,701,736 | -77.39% |
BLOM Preferred Shares Index (BPSI): Today’s Performance
| Last | Previous | Change | |
| BPSI | 104.78 | 104.78 | 0.00% |
| Volume | 25,075 | 700 | |
| Value | 1,025,481 | 70,000 |
Lebanese Stocks: Today’s Trades and Closing Prices
| Last Price ($) | % Change | Volume | VWAP ($) | |
| Solidere A | 7.9 | -5.73% | 98,610 | 7.96 |
| Solidere B | 7.73 | -8.74% | 17,067 | 7.78 |
| Bank Audi | 6.1 | -1.61% | 20,000 | 6.1 |
| Bank Audi GDR | 6.1 | -1.29% | 1,000 | 6.1 |
| Bank Audi Pref G | 100.3 | 0.00% | 5,100 | 100.32 |
| Bank of Beirut Pref I | 25.25 | 0.00% | 19,850 | 25.25 |
| Byblos Bank Pref 2008 | 101.1 | 0.00% | 125 | 101.1 |
| BLOM Bank GDR | 12.3 | 0.00% | 9,827 | 12.3 |
| HOLCIM | 13 | 8.79% | 140.00 | 13 |
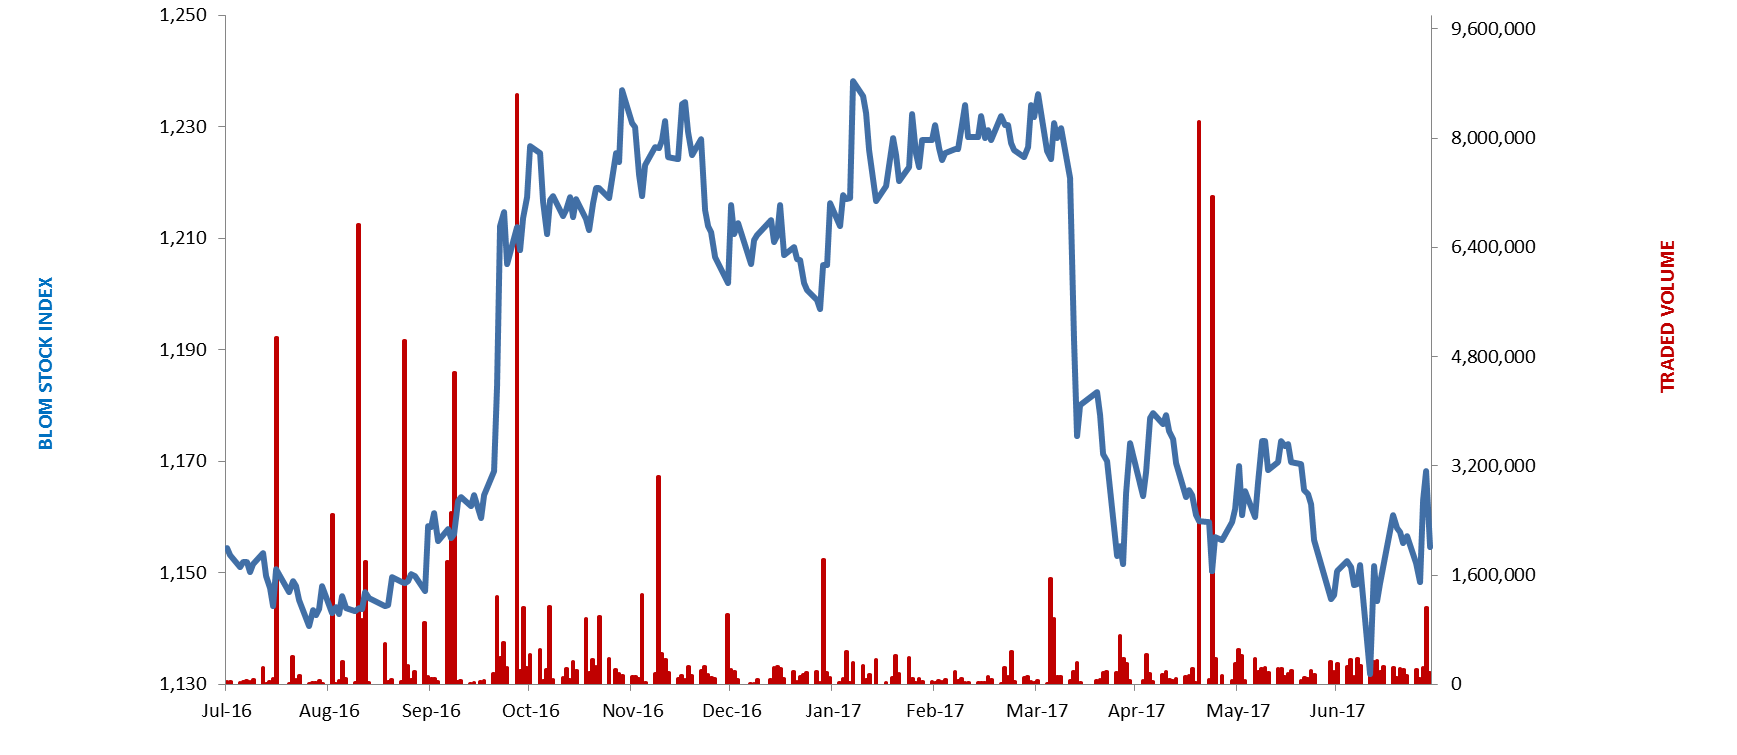
The BLOM Stock Index
Lebanese Global Depository Receipts: Last session’s Performance
| GDRs | Last Price ($) | Previous Price ($) | % Change | Volume | Value ($) |
| BLOM GDR | 12.3 | 12.25 | 0.4% | 5,098 | 62,312 |
| Audi GDR | 6.12 | 6.03 | 1.5% | 417 | 2,552 |
| Byblos GDR | 80 | 80 | 0.0% | – | – |
Source: London Stock Exchange
Closing Date: 27 July 2017
BLOM BOND INDEX: Last Session’s Performance
| Last | Previous | Change | Y-t-D Change | ||
| BBI | 104.49 | 104.27 | 0.21% | 2.54% | |
| Weighted Yield | 6.219% | 6.269% | -5 | bps | |
| Duration (Years) | 5.18 | 5.18 | |||
| 5Y Bond Yield | 6.18% | 6.24% | -6 | bps | |
| 5Y Spread* | 372 | 374 | -2 | bps | |
| 10Y Bond Yield | 6.78% | 6.83% | -5 | bps | |
| 10Y Spread* | 446 | 454 | -8 | bps | |
*between Lebanese Eurobonds and US Treasuries
Closing Date: 27 July 2017
Lebanese Eurobonds: Last Sessions’ Prices and Yields
| Price | Yield | Yield Change | |
| 12/06/2018 | 100.45 | 4.61% | 0 |
| 12/11/2018 | 100.45 | 4.78% | -6 |
| 23/04/2019 | 100.15 | 5.40% | -6 |
| 20/05/2019 | 101.00 | 5.41% | -7 |
| 28/11/2019 | 99.88 | 5.50% | -12 |
| 09/03/2020 | 101.75 | 5.64% | -5 |
| 14/04/2020 | 100.25 | 5.70% | -10 |
| 19/06/2020 | 101.00 | 5.77% | -9 |
| 12/04/2021 | 107.38 | 6.00% | -4 |
| 04/10/2022 | 99.50 | 6.21% | -6 |
| 27/01/2023 | 98.63 | 6.30% | -3 |
| 22/04/2024 | 101.00 | 6.46% | -5 |
| 04/11/2024 | 98.75 | 6.47% | -2 |
| 03/12/2024 | 103.00 | 6.48% | -2 |
| 26/02/2025 | 98.25 | 6.49% | -4 |
| 12/06/2025 | 98.25 | 6.54% | -4 |
| 28/11/2026 | 99.63 | 6.65% | -2 |
| 23/03/2027 | 100.63 | 6.76% | -5 |
| 29/11/2027 | 99.63 | 6.80% | -5 |
| 03/11/2028 | 98.38 | 6.86% | -5 |
| 26/02/2030 | 98.25 | 6.86% | -4 |
| 22/04/2031 | 100.13 | 6.98% | -3 |
| 23/03/2032 | 99.88 | 7.01% | -1 |
| 02/11/2035 | 99.00 | 7.15% | -1 |
| 23/03/2037 | 100.13 | 7.24% | -1 |
| Last Price | Previous | % Change | Y-t-D | |
| $/LBP | 1,513.75 | 1,513.75 | – | |
| €/LBP | 1,765.58 | 1,760.16 | 0.31% | |
| £/LBP | 1,973.32 | 1,972.11 | 0.06% | |
| NEER | 112.27 | 112.21 | 0.05% | -5.18% |
Closing Date: 28 July 2017