
Discover today’s performance of BLOM indices, the closing prices of Lebanese stocks and Eurobonds, as well as the exchange rate of major currencies against the LBP.
BLOM Stock Index (BSI): Today’s Performance
| Last | Previous | % Change | Y-t-D Change | |
| BSI | 1,144.42 | 1,145.71 | -0.11% | -5.63% |
| High | 1,145.71 | 1,146.46 | ||
| Low | 1,144.24 | 1,143.54 | ||
| Volume | 304,600 | 111,728 | 172.63% | |
| Val ($) | 3,244,277 | 966,924 | 235.53% |
BLOM Preferred Shares Index (BPSI): Today’s Performance
| Last | Previous | Change | |
| BPSI | 105.06 | 105.03 | 0.03% |
| Volume | 12,000 | 5,500 | |
| Value | 962,876 | 139,150 |
Lebanese Stocks: Today’s Trades and Closing Prices
| Last Price ($) | % Change | Volume | VWAP ($) | |
| Solidere A | 7.77 | -2.39% | 283,090 | 7.77 |
| Bank Audi Preferred G | 100.3 | – | 2,800 | 100.3 |
| Bank Audi Preferred I | 101.2 | 0.10% | 5,920 | 101.2 |
| Bank of Beirut Pref H | 25.3 | 0.20% | 3,280 | 25.3 |
| Byblos Bank | 1.6 | – | 3,000 | 1.6 |
| BLOM Listed | 11.4 | 0.44% | 4,500 | 11.4 |
| BLOM GDR | 12.4 | 0.08% | 2,010 | 12.4 |
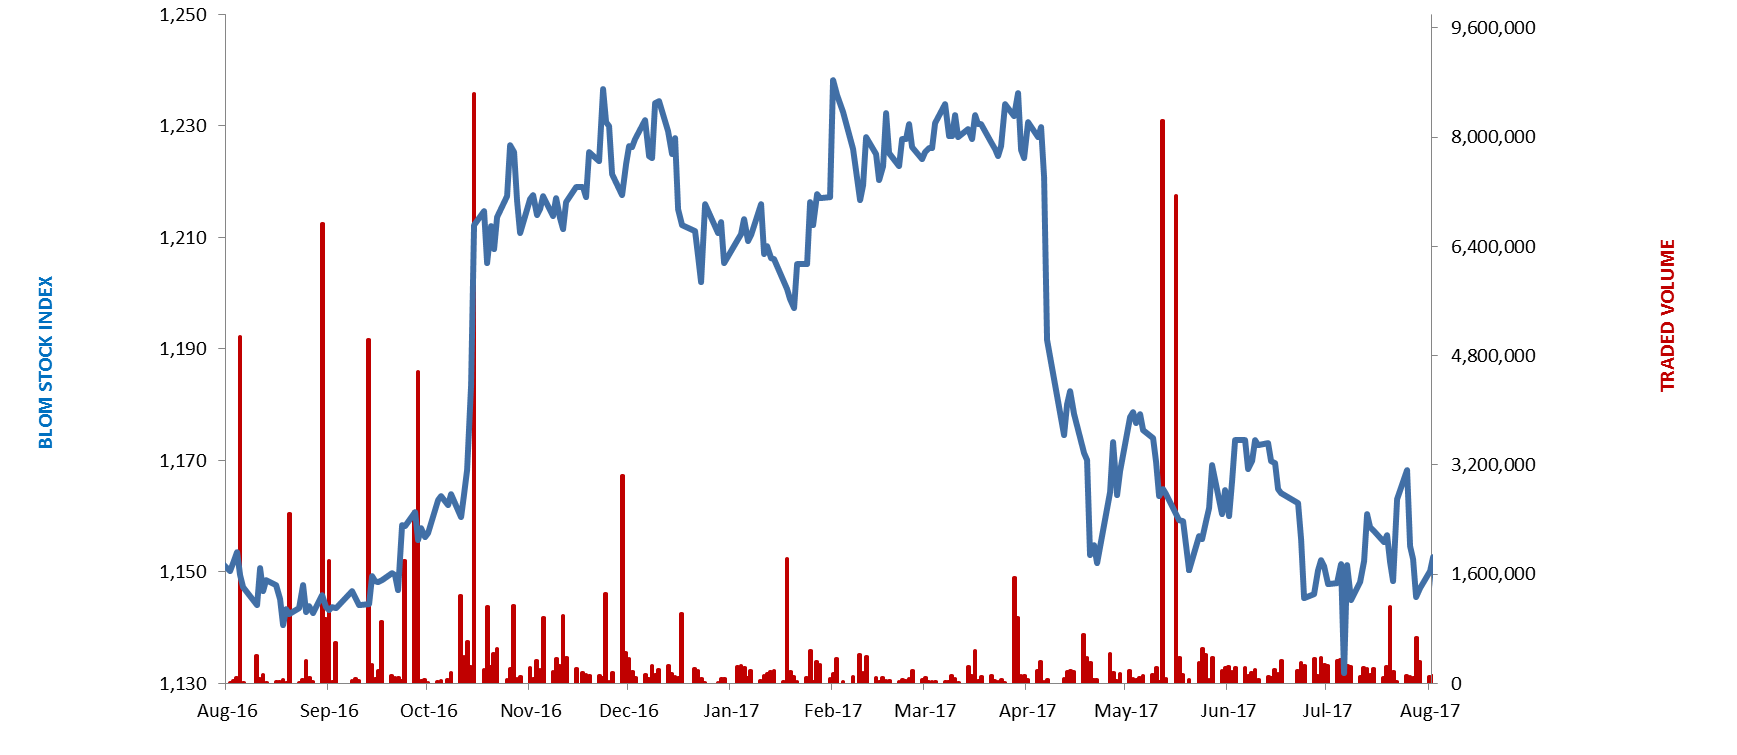
The BLOM Stock Index
Lebanese Global Depository Receipts: Last session’s Performance
| GDRs | Last Price ($) | Previous Price ($) | % Change | Volume | Value ($) |
| BLOM GDR | 12.25 | 12.3 | -0.4% | 9,128 | 111,818 |
| Audi GDR | 6.09 | 6.09 | 0.0% | 5,359 | 32,636 |
| Byblos GDR | 80 | 80 | 0.0% | – | – |
Source: London Stock Exchange
Closing Date: 09 Aug 2017
BLOM BOND INDEX: Last Session’s Performance
| Last | Previous | Change | Y-t-D Change | ||
| BBI | 104.16 | 104.30 | -0.14% | 2.21% | |
| Weighted Yield | 6.278% | 6.250% | 3 | bps | |
| Duration (Years) | 5.15 | 5.15 | |||
| 5Y Bond Yield | 6.28% | 6.24% | 4 | bps | |
| 5Y Spread* | 447 | 440 | 7 | bps | |
| 10Y Bond Yield | 6.81% | 6.80% | 1 | bps | |
| 10Y Spread* | 457 | 451 | 6 | bps | |
*between Lebanese Eurobonds and US Treasuries
Closing Date: 9 August 2017
Lebanese Eurobonds: Last Sessions’ Prices and Yields
| Price | Yield | Yield Change | |
| 12/06/2018 | 100.50 | 4.53% | 0 |
| 12/11/2018 | 100.50 | 4.73% | 0 |
| 23/04/2019 | 100.05 | 5.46% | 6 |
| 20/05/2019 | 100.88 | 5.47% | 7 |
| 28/11/2019 | 99.75 | 5.56% | 0 |
| 09/03/2020 | 101.75 | 5.63% | -5 |
| 14/04/2020 | 99.75 | 5.90% | 16 |
| 19/06/2020 | 100.50 | 5.95% | 15 |
| 12/04/2021 | 107.00 | 6.09% | 4 |
| 04/10/2022 | 99.13 | 6.30% | 3 |
| 27/01/2023 | 98.25 | 6.38% | 6 |
| 22/04/2024 | 100.50 | 6.55% | 5 |
| 04/11/2024 | 98.25 | 6.56% | 4 |
| 03/12/2024 | 102.50 | 6.56% | 4 |
| 26/02/2025 | 97.88 | 6.56% | 2 |
| 12/06/2025 | 98.00 | 6.58% | 2 |
| 28/11/2026 | 99.25 | 6.71% | 0 |
| 23/03/2027 | 100.50 | 6.78% | 0 |
| 29/11/2027 | 99.38 | 6.83% | 2 |
| 03/11/2028 | 98.00 | 6.91% | -3 |
| 26/02/2030 | 97.75 | 6.92% | 6 |
| 22/04/2031 | 99.75 | 7.03% | 3 |
| 23/03/2032 | 99.25 | 7.08% | 3 |
| 02/11/2035 | 98.38 | 7.21% | 6 |
| 23/03/2037 | 99.63 | 7.28% | 0 |
| Last Price | Previous | % Change | Y-t-D | |
| $/LBP | 1,514.00 | 1,514.00 | – | |
| €/LBP | 1,767.85 | 1,771.61 | -0.21% | |
| £/LBP | 1,958.09 | 1,958.39 | -0.02% | |
| NEER | 112.02 | 112.04 | -0.02% | -5.39% |
Closing Date: 10 August 2017