
Discover today’s performance of BLOM indices, the closing prices of Lebanese stocks and Eurobonds, as well as the exchange rate of major currencies against the LBP.
BLOM Stock Index (BSI): Today’s Performance
| Last | Previous | % Change | Y-t-D Change | |
| BSI | 1,148.25 | 1,147.02 | 0.11% | -5.32% |
| High | 1,148.75 | 1,151.68 | ||
| Low | 1,146.28 | 1,144.93 | ||
| Volume | 506,642 | 340,315 | 48.87% | |
| Val ($) | 3,793,720 | 3,018,885 | 25.67% |
BLOM Preferred Shares Index (BPSI): Today’s Performance
| Last | Previous | Change | |
| BPSI | 104.94 | 104.92 | 0.02% |
| Volume | 425 | 3,000 | |
| Value | 42,725 | 301,000 |
Lebanese Stocks: Today’s Trades and Closing Prices
| Last Price ($) | % Change | Volume | VWAP ($) | |
| Solidere A | 8.01 | 7.78% | 409,143 | 8.01 |
| Solidere B | 7.8 | -0.13% | 13,074 | 7.8 |
| Bank Audi | 5.99 | -0.17% | 1,000 | 5.99 |
| Bank Audi Pref G | 100.5 | 0.00% | 400 | 100.5 |
| Byblos Bank – Listed | 1.62 | 1.25% | 60,000 | 1.62 |
| Byblos Bank – Pref 2008 | 101 | 0.20% | 25 | 101 |
| BLOM – Listed | 11.3 | -0.88% | 1,000 | 11.3 |
| BLOM GDR | 12.4 | 0.00% | 20,000 | 12.4 |
| CB (B) | 3.85 | 10.00% | 2,000 | 3.85 |
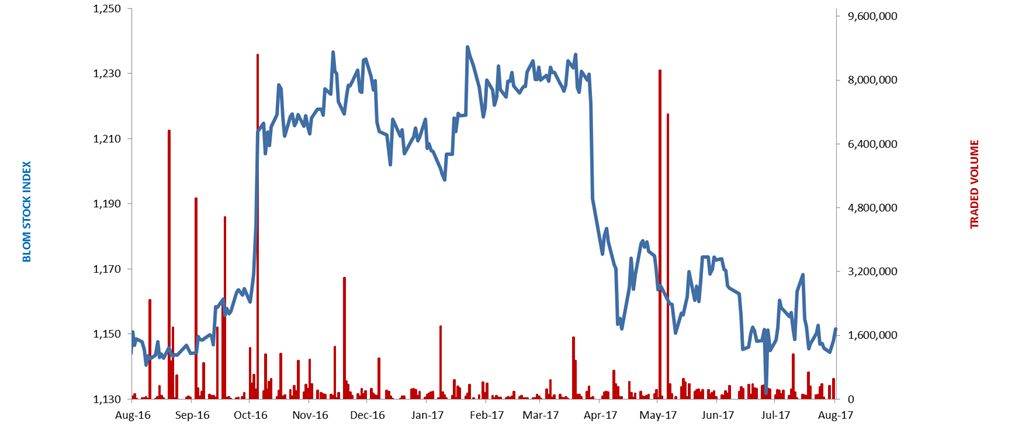
The BLOM Stock Index
Lebanese Global Depository Receipts: Last session’s Performance
| GDRs | Last Price ($) | Previous Price ($) | % Change | Volume | Value ($) |
| BLOM GDR | 12.25 | 12.25 | 0.0% | 20,314 | 248,862 |
| Audi GDR | 6 | 6 | 0.0% | 84,965 | 509,790 |
| Byblos GDR | 80 | 80 | 0.0% | – | – |
Source: London Stock Exchange
Closing Date: 16 Aug 2017
BLOM BOND INDEX: Last Session’s Performance
| Last | Previous | Change | Y-t-D Change | ||
| BBI | 103.89 | 103.86 | 0.03% | 1.96% | |
| Weighted Yield | 6.377% | 6.371% | 1 | bps | |
| Duration (Years) | 5.26 | 5.26 | |||
| 5Y Bond Yield | 6.31% | 6.30% | 1 | bps | |
| 5Y Spread* | 452 | 453 | -1 | bps | |
| 10Y Bond Yield | 6.87% | 6.87% | 0 | bps | |
| 10Y Spread* | 464 | 465 | -1 | bps | |
*between Lebanese Eurobonds and US Treasuries
Closing Date: 16 August 2017
Lebanese Eurobonds: Last Sessions’ Prices and Yields
| Price | Yield | Yield Change | |
| 12/11/2018 | 100.50 | 4.72% | 0 |
| 23/04/2019 | 99.90 | 5.56% | 9 |
| 20/05/2019 | 100.75 | 5.54% | 8 |
| 28/11/2019 | 99.50 | 5.68% | 12 |
| 09/03/2020 | 101.50 | 5.74% | 5 |
| 14/04/2020 | 99.75 | 5.90% | 0 |
| 19/06/2020 | 100.50 | 5.95% | 0 |
| 12/04/2021 | 106.88 | 6.12% | 0 |
| 04/10/2022 | 99.00 | 6.33% | 0 |
| 27/01/2023 | 98.13 | 6.41% | -3 |
| 22/04/2024 | 100.25 | 6.60% | -5 |
| 04/11/2024 | 98.13 | 6.58% | 0 |
| 03/12/2024 | 102.25 | 6.60% | -4 |
| 26/02/2025 | 97.50 | 6.63% | 2 |
| 12/06/2025 | 97.50 | 6.66% | 4 |
| 28/11/2026 | 99.25 | 6.71% | -4 |
| 23/03/2027 | 100.00 | 6.85% | 0 |
| 29/11/2027 | 99.00 | 6.89% | 0 |
| 03/11/2028 | 97.50 | 6.97% | -2 |
| 26/02/2030 | 97.25 | 6.98% | -1 |
| 22/04/2031 | 99.75 | 7.03% | -6 |
| 23/03/2032 | 99.25 | 7.08% | -6 |
| 02/11/2035 | 98.25 | 7.22% | -1 |
| 23/03/2037 | 99.13 | 7.33% | 1 |
| Last Price | Previous | % Change | Y-t-D | |
| $/LBP | 1,514.00 | 1,514.00 | – | |
| €/LBP | 1,764.38 | 1,774.03 | -0.54% | |
| £/LBP | 1,939.25 | 1,954.32 | -0.77% | |
| NEER | 112.16 | 112.26 | -0.10% | -5.28% |
Closing Date: 17 August 2017