
The number of construction permits experienced a yearly fall of 13.27% to reach its lowest level in 6 years at 9,814 in the first 8 months of the year, compared to a higher level of 11,315 during the same period last year. In the same context, the construction area authorized by permits (CAP) recorded a 13.57% year-on-year (y-o-y) descent amounting to 8.22M sqm by August this year, compared to 9.51M sqm by August 2014.
Noting that permits are usually issued at least 6 months after applications are filed, the fall in construction activity is due to the ongoing slowdown in the whole economy attributed to the slump in Foreign Direct Investments (FDIs), the drops in tourism since 2011, and the regional and domestic instability that is putting a downward pressure on demand. The six-month moving average of the number of construction permits illustrates the decline witnessed in the sector since 2011.
The average area per transaction barely dipped, from 840.32 sqm/permit in 2014 to 837.37 sqm/permit by August of this year.
In August alone, the number of permits stood at 1,162, a 4.68% y-o-y down tick from August 2014’s level. In contrast, CAP witnessed a 30.25% yearly surge to 1.34M sqm from 1.03M sqm registered in August of last year. In Mount Lebanon alone, CAP increased yearly by almost 50% to 775K sqm, contributing to the ascent in overall construction area during the month. In terms of regions, Mount Lebanon grasped 41.91% of total permits, while South Lebanon and Nabatiye took respective shares of 16.78% and 12.74%.
Monthly Number of Construction Permits
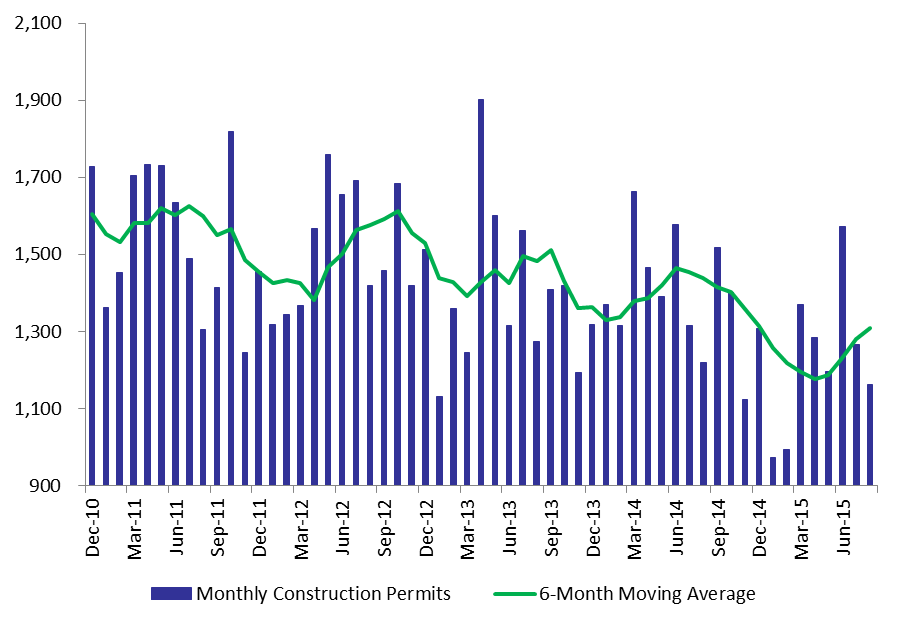
Source: Orders of Engineers in Beirut and North