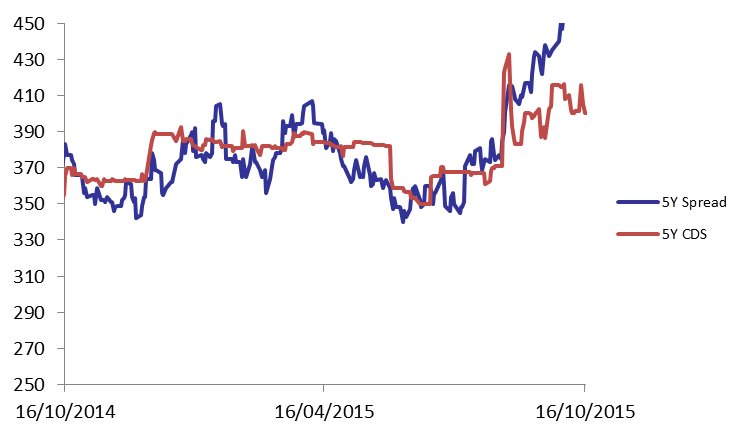
Demand for Lebanese Eurobonds progressed on Monday, which caused the BLOM Bond Index (BBI) to increase by 0.20% to 105.06 points, narrowing its year-to-date loss to 2.25%. Yields on the 5Y and 10Y Lebanese Eurobonds dropped by 5 basis points (bps) and 4 bps to 5.93% and 6.45%, respectively. In the US, demand for medium term maturities improved but at a slower pace than that of its Lebanese counterpart, causing the 5Y spread between the two notes to narrow by 4 bps to 458 bps. As for the Lebanese 5Y Credit Default Swaps (CDS), they remained at their previous quotes of 394-417 bps.
| Last | Previous | Change | Y-t-D Change | ||
| BBI | 105.056 | 104.843 | 0.203% | -2.25% | |
| Weighted Yield | 5.90% | 5.93% | -3 | bps | |
| Duration (Years) | 4.94 | 4.94 | |||
| 5Y Bond Yield | 5.93% | 5.98% | -5 | bps | |
| 5Y Spread* | 458 | 462 | -4 | bps | |
| 10Y Bond Yield | 6.45% | 6.49% | -4 | bps | |
| 10Y Spread* | 441 | 445 | -4 | bps | |
*Between Lebanese and U.S notes
| Price | Yield | Yield Change (in bps) | |
| Nov. 2016 | 100.4 | 4.35% | 0 |
| Mar. 2017 | 105.5 | 4.93% | -2 |
| Oct. 2017 | 99.75 | 5.13% | 0 |
| Jun. 2018 | 99.75 | 5.25% | 0 |
| Nov. 2018 | 99.5 | 5.33% | 0 |
| Apr. 2019 | 100 | 5.50% | 0 |
| May. 2019 | 101.38 | 5.57% | -4 |
| Nov.2019 | 99.13 | 5.69% | -4 |
| Mar. 2020 | 102.25 | 5.79% | -3 |
| Apr. 2020 | 100 | 5.80% | -6 |
| Apr. 2021 | 110.13 | 6.05% | -5 |
| Oct. 2022 | 99.75 | 6.14% | -7 |
| Jan. 2023 | 99 | 6.17% | -4 |
| Dec. 2024 | 104.5 | 6.34% | -5 |
| Feb. 2025 | 98.88 | 6.36% | -5 |
| Jun. 2025 | 98.88 | 6.41% | -5 |
| Nov. 2026 | 100.38 | 6.55% | -5 |
| Nov. 2027 | 101.13 | 6.61% | -5 |
| Feb. 2030 | 99.25 | 6.73% | -3 |