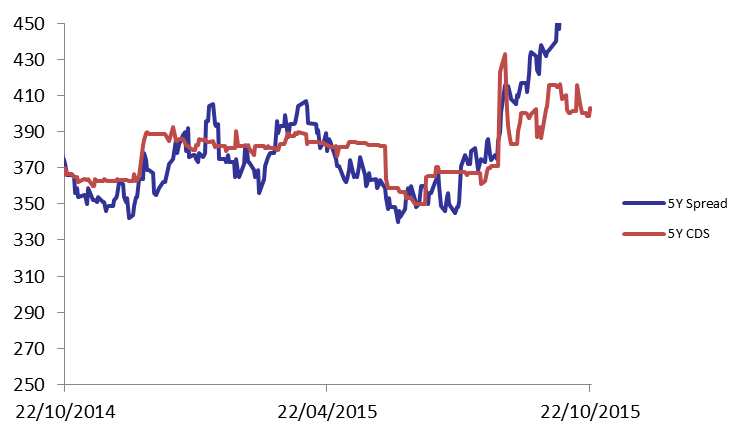
Demand for Lebanese Eurobonds barely changed during the last session of the past week, which caused the BLOM Bond Index (BBI) to tick down by 0.02% to 105.03 points, broadening its year-to-date loss to 2.27%. Yields on the 5Y and 10Y Lebanese Eurobonds steadied at Thursday’s level of 5.96% and 6.45%, respectively. In the US, demand for medium term maturities weakened, causing the 5Y spread between the Lebanese Eurobonds and their U.S counterpart to narrow by 7 basis points (bps) to 453 bps. As for the Lebanese 5Y Credit Default Swaps (CDS), they slightly tightened from their previous quotes of 392-415 bps to 391-414 bps.
| Last | Previous | Change | Y-t-D Change | ||
| BBI | 105.029 | 105.047 | -0.017% | -2.27% | |
| Weighted Yield | 5.90% | 5.90% | 0 | bps | |
| Duration (Years) | 4.92 | 4.92 | |||
| 5Y Bond Yield | 5.96% | 5.96% | 0 | bps | |
| 5Y Spread* | 453 | 460 | -7 | bps | |
| 10Y Bond Yield | 6.45% | 6.45% | 0 | bps | |
| 10Y Spread* | 436 | 441 | -5 | bps | |
*Between Lebanese and U.S notes
| Price | Yield | Yield Change (in bps) | |
| Nov. 2016 | 100.39 | 4.36% | 0 |
| Mar. 2017 | 105.5 | 4.90% | -1 |
| Oct. 2017 | 99.75 | 5.13% | 0 |
| Jun. 2018 | 99.75 | 5.25% | 0 |
| Nov. 2018 | 99.5 | 5.33% | 0 |
| Apr. 2019 | 100 | 5.50% | 0 |
| May. 2019 | 101.25 | 5.61% | 0 |
| Nov.2019 | 99 | 5.73% | 0 |
| Mar. 2020 | 102.25 | 5.78% | 0 |
| Apr. 2020 | 99.75 | 5.86% | 0 |
| Apr. 2021 | 110.25 | 6.02% | 0 |
| Oct. 2022 | 99.75 | 6.14% | 0 |
| Jan. 2023 | 99 | 6.17% | 0 |
| Dec. 2024 | 104.5 | 6.34% | 0 |
| Feb. 2025 | 98.88 | 6.36% | 0 |
| Jun. 2025 | 98.88 | 6.41% | 0 |
| Nov. 2026 | 100.38 | 6.55% | 2 |
| Nov. 2027 | 101.13 | 6.61% | 0 |
| Feb. 2030 | 99.13 | 6.74% | 1 |