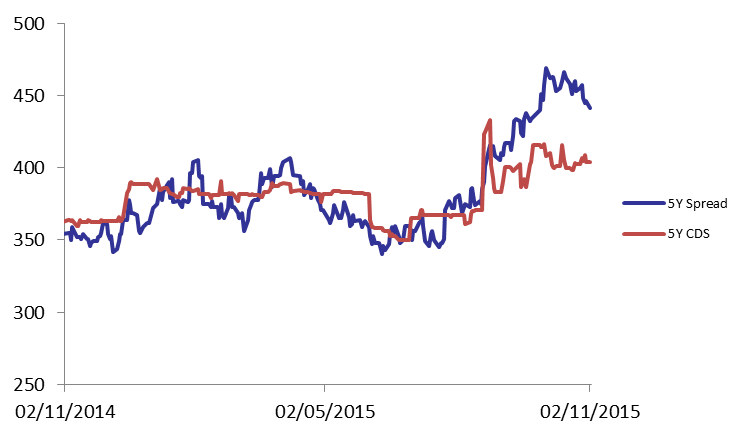
Demand for Lebanese Eurobonds stagnated during the first session of the week, which caused the BLOM Bond Index (BBI) to remain at 104.86 points, registering a year-to-date loss of 2.43%. Yields on the 5Y and 10Y Lebanese Eurobonds steadied at Friday’s levels of 5.98% and 6.45%, respectively, while demand for medium term maturities in the U.S. weakened. Accordingly, the 5Y spread between the Lebanese Eurobonds and their U.S counterpart narrowed by 5 basis points (bps) to 441 bps. As for the Lebanese 5Y Credit Default Swaps (CDS), they were unchanged, steadying at 392-416 bps.
| Last | Previous | Change | Y-t-D Change | ||
| BBI | 104.860 | 104.860 | 0.000% | -2.43% | |
| Weighted Yield | 5.93% | 5.93% | 0 | bps | |
| Duration (Years) | 4.89 | 4.90 | |||
| 5Y Bond Yield | 5.98% | 5.98% | 0 | bps | |
| 5Y Spread* | 441 | 446 | -5 | bps | |
| 10Y Bond Yield | 6.45% | 6.45% | 0 | bps | |
| 10Y Spread* | 425 | 429 | -4 | bps | |
*Between Lebanese and U.S notes
| Price | Yield | Yield Change (in bps) | |
| Nov. 2016 | 100.39 | 4.35% | 0 |
| Mar. 2017 | 105.38 | 4.92% | -2 |
| Oct. 2017 | 99.75 | 5.14% | 0 |
| Jun. 2018 | 99.75 | 5.25% | 0 |
| Nov. 2018 | 99.38 | 5.37% | 0 |
| Apr. 2019 | 100 | 5.50% | 0 |
| May. 2019 | 101.25 | 5.61% | 0 |
| Nov.2019 | 98.75 | 5.80% | 0 |
| Mar. 2020 | 102 | 5.85% | 0 |
| Apr. 2020 | 99.75 | 5.86% | 0 |
| Apr. 2021 | 110 | 6.06% | 0 |
| Oct. 2022 | 99.63 | 6.17% | 0 |
| Jan. 2023 | 98.88 | 6.19% | 0 |
| Dec. 2024 | 104.5 | 6.34% | 0 |
| Feb. 2025 | 98.88 | 6.36% | 0 |
| Jun. 2025 | 98.88 | 6.41% | 0 |
| Nov. 2026 | 100 | 6.60% | 0 |
| Nov. 2027 | 101 | 6.63% | 0 |
| Feb. 2030 | 98.63 | 6.80% | 0 |