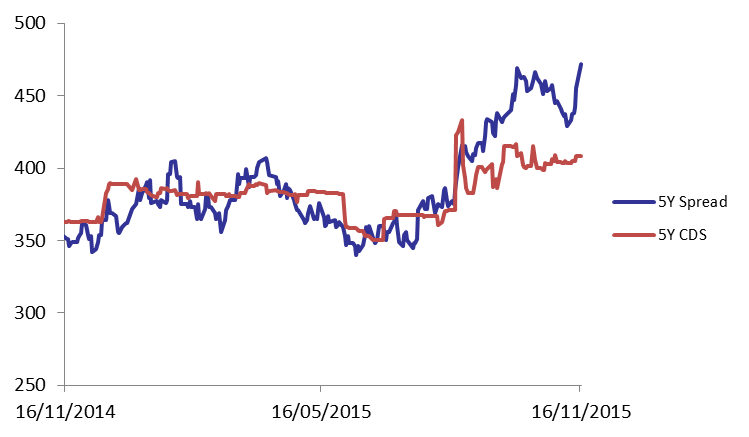
Following last week’s long awaited parliamentary session, which finally convened for the 1st time since a year, investors seemed to be more oriented towards risky assets on the expense of Lebanon’s Eurobonds market, thus demand for Lebanese Eurobonds substantially weakened pushing the BLOM Bond Index (BBI) by 0.78% to 103.01 points, broadening its year-to-date loss to 4.15%. The Yields on the 5Y and 10Y Lebanese Eurobonds increased by 16 basis points (bps) and 23 bps to 6.38% and 6.92%, respectively. As demand for medium term maturities in the U.S. improved, the spread between the yields of the 5Y Lebanese Eurobonds and their U.S. counterpart broadened by 17 bps to 472 bps. As for the Lebanese 5Y Credit Default Swaps (CDS), they remained at their previous quotes of 392-417 bps.
| Last | Previous | Change | Y-t-D Change | ||
| BBI | 103.014 | 103.826 | -0.782% | -4.15% | |
| Weighted Yield | 6.26% | 6.13% | 13 | bps | |
| Duration (Years) | 4.83 | 4.85 | |||
| 5Y Bond Yield | 6.38% | 6.22% | 16 | bps | |
| 5Y Spread* | 472 | 455 | 17 | bps | |
| 10Y Bond Yield | 6.92% | 6.69% | 23 | bps | |
| 10Y Spread* | 465 | 441 | 24 | bps | |
*Between Lebanese and U.S notes
| Price | Yield | Yield Change (in bps) | |
| Nov. 2016 | 100 | 4.75% | 0 |
| Mar. 2017 | 105.13 | 5.00% | -2 |
| Oct. 2017 | 99.5 | 5.28% | 7 |
| Jun. 2018 | 99.25 | 5.46% | 6 |
| Nov. 2018 | 99 | 5.52% | 0 |
| Apr. 2019 | 99.5 | 5.66% | 0 |
| May. 2019 | 100.75 | 5.76% | -8 |
| Nov.2019 | 97.75 | 6.09% | 11 |
| Mar. 2020 | 101 | 6.10% | 7 |
| Apr. 2020 | 98.75 | 6.13% | 7 |
| Apr. 2021 | 107.25 | 6.63% | 32 |
| Oct. 2022 | 97 | 6.65% | 26 |
| Jan. 2023 | 96.13 | 6.68% | 25 |
| Dec. 2024 | 101.13 | 6.83% | 28 |
| Feb. 2025 | 95.63 | 6.84% | 23 |
| Jun. 2025 | 95.75 | 6.86% | 20 |
| Nov. 2026 | 97.5 | 6.93% | 15 |
| Nov. 2027 | 97.75 | 7.03% | 20 |
| Feb. 2030 | 95.75 | 7.13% | 14 |