
Perhaps one of the few positives witnessed in Jordan recently has been the lower number of Syrian refugees, with official numbers as of April 2016 placing the figure at around 640,000, compared to above 800,000 towards the end of 2014. An increased number of refugees have been granted asylum in Europe, with Germany, Turkey, Egypt, Hungary and other European nations accepting increasing numbers in the past year. However, the funding issue still remains a major concern, with only $80.73M of the required $1.11B received by March 22nd. In reaction to the crisis being encountered, Jordan demanded the implementation of a new strategy targeting economic development at the “Supporting Syria and the Region” conference in London at end-January, alongside the necessary humanitarian relief for the refugees. The Hashemite Kingdom displayed weaker performances across all its major economic sectors, with general and fiscal deficits expanding, and the drop in tourism activity continuing in 2016.
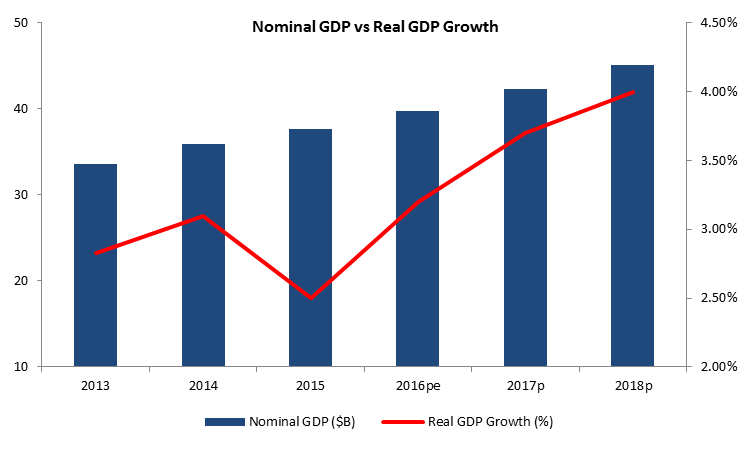
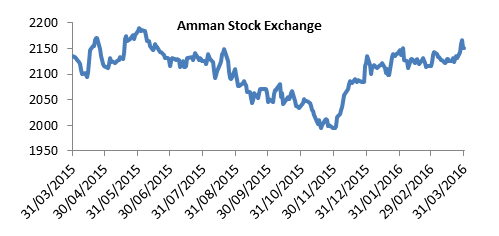
On the economic front, the International Monetary Fund (IMF) released its World Economic Outlook (WEO) April 2016 edition, in which it revised earlier growth expectations downwards for the majority of the world’s economies, citing lower oil prices, cheaper commodities and geopolitical tensions as key drivers behind lower growth expectations in the Middle East in particular. The Hashemite Kingdom was no exception to this rule, as expected growth rates for GDP were revised down from 2.85%, 3.75% and 4.50% for the years 2015 till 2017 to lower expectations of 2.50%, 3.20% and 3.70%, respectively. Also, the Consumer Price Index revealed a 0.7% drop during January 2016 compared to January 2015. Jordan’s tourism sector ended 2015 on a sour note, as the total number of tourists displayed a 9.71% y-o-y drop to 4.81M tourists. Saudi Arabians represented the biggest group of tourists, but their numbers declined by 16.8% to 883,884 tourists. The largest non-Arab group represents tourists were from the United States, whose number almost remained constant, gaining 0.15% y-o-y to 161,013 tourists during 2015. Moreover, preliminary indicators of the performance of the tourism sector for 2016 may be signaling that performance will not pick up any time soon. The Central Bank of Jordan (CBJ) reported a decrease in travel receipts by 6.40% to $333.47M (JOD 236.5M), while the Ernst & Young Middle East hotel benchmark survey indicated that the first quarter of 2016 performed even worse than that of 2015, as the occupancy rate declined by 5 basis points (bps) to 48% while the Average Room Rate and the Rooms Yield each declined by 1.90% and 10.71% to respective values of $155 and $75. On the external front, Jordan’s trade deficit began the year with a 36.99% y-o-y expansion during January to $1.09B (JOD 773.54M). The Kingdom’s imports gained 13.70% in value to $1.60B (JOD 1.14B), while exports and re-exports dropped by 15.02% and 23.00% to respective values of $420.15M (JOD 297.55M) and $91.53M (JOD 64.82M). The rise in the value of imports was most clearly evident in natural gas, electrical machinery and vehicles. These three import commodities increased by 170.39%, 77.25%, and 27.76% annually to new values of $70.19M (JOD 49.71M), $11.38M (JOD 78.88M) and $150.62M (JOD 106.67M), respectively. The significant rise in natural gas imports can be traced back to the two contracts awarded to liquefied natural gas (LNG) suppliers Gunvor in Switzerland and Gas Natural in Spain. These companies began supplying Jordan’s electricity company NEPCO with natural gas during the quarter, and probably resulted from NEPCO’s decision to rely more on LNG for power generation instead of fuel and diesel. Meanwhile, key export commodities that displayed declines in value compared to January of last year were mineral and chemical fertilizers, which dropped by 34.62% y-o-y to $22.27M (JOD 15.77M), potassium crude, losing 32.59% annually to a new value of $26.98M (JOD 19.11M), and phosphates, whose export value dropped by 20.21% compared to January 2015 to $28.54M (JOD 20.22M). Jordan’s fiscal sector also displayed signs of struggling to cope with macro-economic strains, as the general budget deficit, inclusive of foreign grants, stood at $1.31B (JOD 928.60M) by December 2015. This equaled a 59.14% y-o-y widening of 2014’s deficit, as the 6.49% annual drop in public revenues to $9.58B (JOD 6.80B) outpaced the 1.61% drop in public expenditures to $10.89B (JOD 7.72B) over the same period. Net outstanding public debt also rose by 11.15% over the year to $32.21 (JOD 22.85B), equivalent to 85.8% of the Kingdom’s GDP. This debt can be broken to net outstanding domestic debt, which stood at $18.97B (JOD 13.45B), or 50.5% of GDP, and outstanding external public debt equal to $13.24B (JOD 9.39B), standing at 35.3% of GDP. On the monetary front, Jordan witnessed a slowdown in money supply (M2) during the first 2 months of 2016, as it registered a slower 0.50% y-t-d growth by February compared to 0.90% over the same period last year, as net foreign assets shed 3.50% y-t-d to $11.06B (JOD 7.84B). As of February 2016, total credit facilities had registered a 0.92% gain from December 2015 to reach $30.03B (JOD 21.30B). Meanwhile, total deposits gained 0.60% to reach $46.26B (JOD 32.86B), translating into a 64.92% loan to deposit ratio by February 2016, up from 64.74% at end-2015. Interest rates remained stable since July 2015, with the re-discount rate and the overnight repo rate at 3.75% and 3.50%, respectively. Meanwhile, the interbank rate dropped from 3.00% in December 2014 to 2.08% by end-2015. Over the first quarter of 2016, the Amman Stock Exchange (ASE) gained 0.73%, closing the trading session on March 31st 2016 at 2,151.89 points. However, the index’s market cap dropped 3.06% from end-2015 to end Q1 2016 at $24.58B (JOD 17.43B), following the delisting of 3 securities. Also, the index’s Price to Earnings ratio (P/E) increased from 13.11 at end-2015 to 16.167 by end-March 2016. Over the first three months, the total value of traded shares registered $590.41M (JOD 418.73M), compared to a higher $654.49M (JOD 464.18M) during Q1 2015.