Discover today’s performance of BLOM indices, the closing prices of Lebanese stocks and Eurobonds, as well as the exchange rate of major currencies against the LBP.
BLOM Stock Index (BSI): Today’s Performance
| Last | Previous | % Change | Y-t-D Change | |
| BSI | 1,184.53 | 1,168.28 | 1.39% | 1.20% |
| High | 1,188.53 | 1,172.71 | ||
| Low | 1,164.47 | 1,164.03 | ||
| Volume | 1,282,054 | 162,250 | 690.17% | |
| Val ($) | 13,095,625 | 1,907,413 | 586.56% |
BLOM Preferred Shares Index (BPSI): Today’s Performance
| Last | Previous | Change | |
| BPSI | 104.54 | 104.44 | 0.10% |
| Volume | 3,980 | 92,770 | |
| Value | 405,094 | 1,210,655 |
Lebanese Stocks: Today’s Trades and Closing Prices
| Last Price ($) | % Change | Volume | VWAP ($) | |
| Solidere A | 10.76 | 9.57% | 139,660 | 10.23 |
| Solidere B | 10.28 | 3.32% | 22,124 | 10.12 |
| BYBLOS | 1.63 | – | 8,403 | 1.63 |
| BLOM (GDR) | 10.30 | 0.78% | 15,000 | 10.30 |
| Audi (GDR) | 6.40 | 2.40% | 10,000 | 6.40 |
| BLOM Listed | 10.04 | 0.40% | 1,076,201 | 10.00 |
| Audi (C) | 6.20 | -0.64% | 6,686 | 6.20 |
| Byblos Pref 08 | 101.10 | -0.10% | 100 | 101.10 |
| Audi Pref G | 101.80 | 1.09% | 3,880 | 101.80 |
| Audi Pref F | 100.50 | – | – | – |
| Audi Pref H | 101.00 | – | – | – |
| BEMO (C) | 1.72 | – | – | – |
| BEMO PREF 13 | 100.00 | – | – | – |
| BLC (C) | 2.77 | – | – | – |
| BLC Pref B | 100.00 | – | – | – |
| BLC Pref C | 100.00 | – | – | – |
| BLOM Pref 2011 | 10.00 | – | – | – |
| BoB (C) | 18.80 | – | – | – |
| BOB Pref H | 26.00 | – | – | – |
| BoB Pref I | 26.00 | – | – | – |
| BOB Preferred J | 26.00 | – | – | – |
| BOB Preferred K | 25.00 | – | – | – |
| BoB Priority 2014 | 21.00 | – | – | – |
| Byblos Pref 09 | 101.30 | – | – | – |
| CB (B) | 2.70 | – | – | – |
| CB (N) | 3.10 | – | – | – |
| HOLCIM Liban | 14.50 | – | – | – |
| RYMCO | 3.25 | – | – | – |
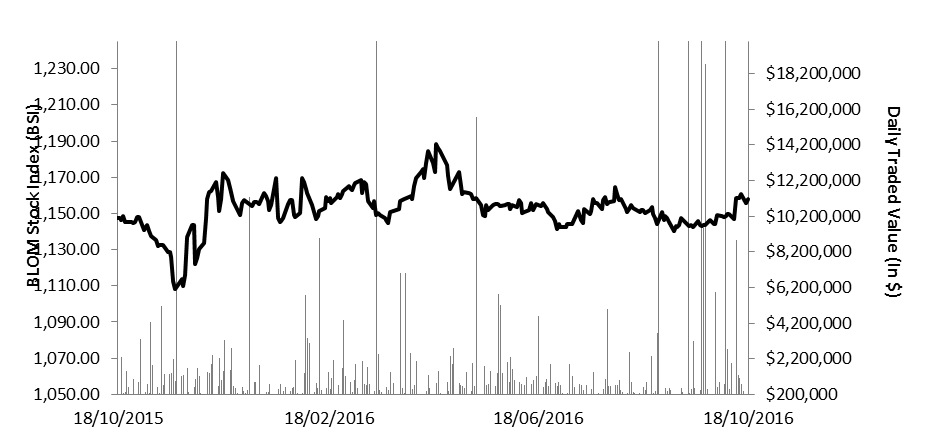
The BLOM Stock Index 52-WEEK TREND
Lebanese Global Depository Receipts: Last session’s Performance
| GDRs | Last Price ($) | Previous Price ($) | % Change | Volume | Value ($) |
| BLOM GDR | 10.30 | 10.30 | – | 34,341 | 350,278 |
| Audi GDR | 6.25 | 6.25 | – | 9,150 | 57,188 |
| Byblos GDR | 80.00 | 80.00 | – | – | – |
| Solidere GDR | 10.20 | 9.80 | 4.08% | 1,000 | 10,200 |
Source: Reuters, Closing Date: 17 October 2016
BLOM BOND INDEX: Last Session’s Performance
| Last | Previous | Change | Y-t-D Change | ||
| BBI | 102.57 | 102.57 | 0.00% | -1.48% | |
| Weighted Yield | 6.51% | 6.51% | 0 | bps | |
| Duration (Years) | 5.02 | 5.02 | |||
| 5Y Bond Yield | 6.35% | 6.35% | 0 | bps | |
| 5Y Spread* | 509 | 507 | 2 | bps | |
| 10Y Bond Yield | 6.97% | 6.97% | 0 | bps | |
| 10Y Spread* | 520 | 517 | 3 | bps | |
*between Lebanese Eurobonds and US Treasuries
Closing Date: 17 October 2016
Lebanese Eurobonds: Last Sessions’ Prices and Yields
| Price | Yield | Yield Change (in bps) | |
| Oct. 2017 | 99.35 | 5.69% | 1 |
| Jun. 2018 | 99 | 5.79% | 0 |
| Nov. 2018 | 98.65 | 5.85% | 0 |
| Apr. 2019 | 98.88 | 5.99% | 0 |
| May. 2019 | 99.25 | 6.32% | 0 |
| Nov.2019 | 98.38 | 6.03% | 0 |
| Mar. 2020 | 100.63 | 6.16% | 0 |
| Apr. 2020 | 98.85 | 6.17% | 0 |
| Apr. 2021 | 107.5 | 6.30% | 0 |
| Oct. 2022 | 97.88 | 6.53% | 0 |
| Jan. 2023 | 97 | 6.59% | 0 |
| Apr.2024 | 96.38 | 6.84% | 0 |
| Nov. 2024 | 99 | 6.82% | 0 |
| Dec. 2024 | 101 | 6.84% | 0 |
| Feb. 2025 | 95.88 | 6.85% | 0 |
| Jun. 2025 | 95.88 | 6.89% | 0 |
| Nov. 2026 | 97.13 | 7.00% | 0 |
| Nov. 2027 | 97.88 | 7.03% | 0 |
| Nov. 2028 | 96.75 | 7.05% | 0 |
| Feb. 2030 | 96 | 7.12% | 0 |
| Apr. 2031 | 98.5 | 7.17% | 0 |
| Nov. 2035 | 98.5 | 7.20% | 0 |
| Last Price | Previous | % Change | Y-t-D | |
| $/LBP | 1,514.00 | 1,514.00 | – | |
| €/LBP | 1,660.36 | 1,658.55 | 0.11% | |
| £/LBP | 1,848.35 | 1,836.59 | 0.64% | |
| NEER | 264.37 | 264.86 | -0.18% | 57.00% |
Closing Date: 18 October