Data from the Customs reveal the Lebanese trade deficit spiraled by 6.3% y-o-y to reach $14.4B by Nov. 2016 as exports increased by a yearly 3.47% to $2.81B and imports rose by 5.81% y-o-y to $17.2B.
In terms of imports, Mineral Products constituting 20.33% of total imports increased in value by 23% y-o-y to $3.5B despite the fall of average oil prices from $54.97/barrel by Nov. 2015 to $44.26/barrel by Nov. 2016. This is justified by the 27% y-o-y surge recorded in the volume of mineral products to 8.19M tons.
Similarly, Products of the Chemical or Allied Industries grasped 10.85% of the total value of imports and rose by a yearly 4.77% to $1.9B. However, Machinery and Electrical Instruments, which constitute 10.01% of total imports, declined by 6.98% yearly, to stand at $1.72B by Nov.2016.
By Nov. 2016, Lebanon imported mostly from China, Italy, USA, Germany, and Greece, with the respective shares of 11.17%, 7.4%, 6.37%, 6.21%, and 5.48% of total imports.
In terms of Exports, Pearls, Precious stones and Metals constituting 30.46% of total exports rose by 91.7% y-o-y to reach $780.7M by Nov. 2016. However, Prepared foodstuffs, beverages, tobacco which make up 15.45% of total exports fell by a yearly 8.62% and settled at $406.32M by Nov.2016. Machinery and electrical instruments (12.66% of total exports) also declined from $378.9M by Nov.2015 to $324.4M by Nov. 2016. Similarly, Products of the chemical or allied industries (10.72% of total exports) decreased most by 26.42% y-o-y to stand at $274.8M by Nov.2016.
The main destinations for Lebanon’s exports over the same period were: South Africa, Saudi Arabia, United Arab Emirates, Syria, and Iraq with respective weights of 22%, 9%, 8%, 6%, and 5% of the total value of exports.
Trade Deficit by November (in $B)
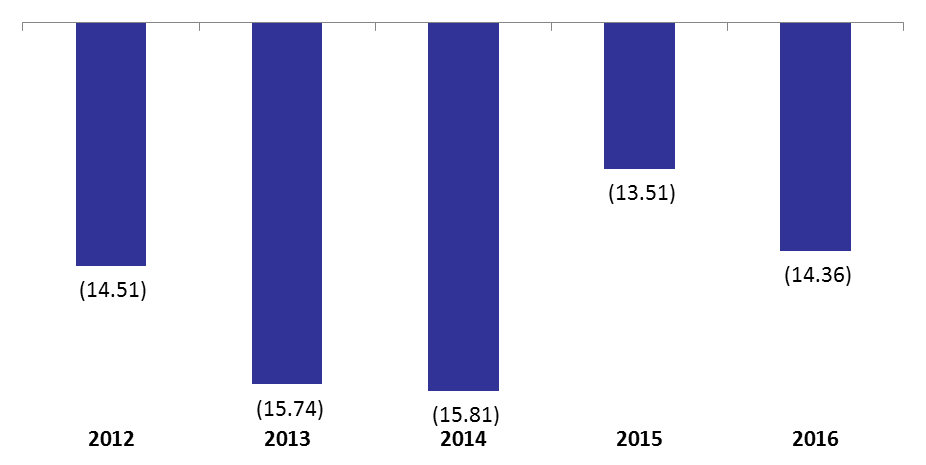
Source: Lebanese Customs