
Discover today’s performance of BLOM indices, the closing prices of Lebanese stocks and Eurobonds, as well as the exchange rate of major currencies against the LBP.
BLOM Stock Index (BSI): Today’s Performance
| Last | Previous | %Change | Y-t-D Change | |
| BSI | 1,210.51 | 1,209.76 | 0.36% | 3.44% |
| High | 1,212.25 | 1,210.44 | ||
| Low | 1,207.23 | 1,206.32 | ||
| Volume | 68,276 | 16,220 | 23.68% | |
| Val ($) | 707,045 | 202,935 | 13.35% |
BLOM Preferred Shares Index (BPSI): Today’s Performance
| Last | Previous | Change | |
| BPSI | 105.30 | 105.30 | -0.01% |
| Volume | – | 338 | |
| Value | 105.30 | 105.30 | -0.01% |
Lebanese Stocks: Today’s Trades and Closing Prices
| Last Price ($) | % Change | Volume | VWAP ($) | |
| Solidere A | 10.22 | -0.78% | 53,802 | 10.29 |
| Solidere B | 10.19 | – | 4,797 | 10.22 |
| Byblos Listed | 1.70 | – | 84 | 1.70 |
| BLOM Listed | 10.62 | -0.28% | 4,593 | 10.62 |
| BLOM GDR | 11.20 | 2.28% | 5,000 | 11.20 |
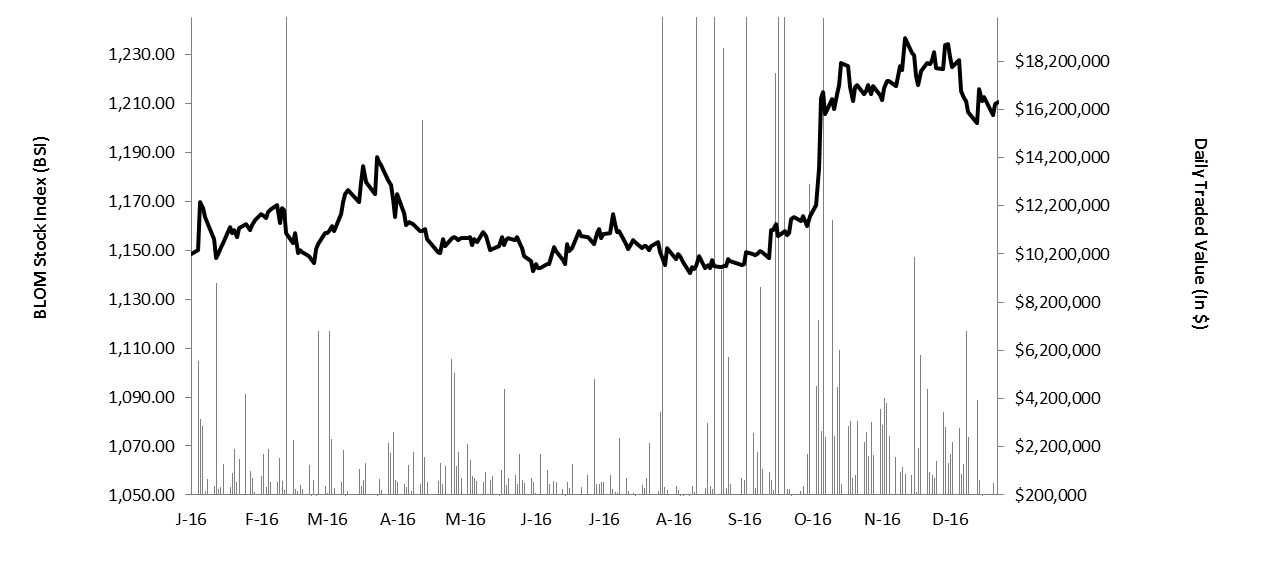
The BLOM Stock Index 52-WEEK TREND
Lebanese Global Depository Receipts: Last session’s Performance
| GDRs | Last Price ($) | Previous Price ($) | % Change | Volume | Value ($) |
| BLOM GDR | 11.00 | 11.00 | – | 7,181 | 78,991 |
| Audi GDR | 6.50 | 6.50 | – | – | – |
| Byblos GDR | 79.00 | 79.00 | – | – | – |
| Solidere GDR | 10.05 | 10.25 | -1.95% | 974 | 9,789 |
Source: Reuters
Closing Date: 04 January 2017
BLOM BOND INDEX: Last Session’s Performance
| Last | Previous | Change | Y-t-D Change | ||
| BBI | 102.11 | 101.90 | 0.21% | 0.21% | |
| Weighted Yield | 6.63% | 6.67% | -4 | bps | |
| Duration (Years) | 5.05 | 5.06 | |||
| 5Y Bond Yield | 6.61% | 6.67% | -6 | bps | |
| 5Y Spread* | 467 | 474 | -7 | bps | |
| 10Y Bond Yield | 7.09% | 7.11% | -2 | bps | |
| 10Y Spread* | 463 | 466 | -3 | bps | |
*between Lebanese Eurobonds and US Treasuries
Closing Date: 04 January 2017
Lebanese Eurobonds: Last Sessions’ Prices and Yields
| day/month/year | Price | Yield | Yield Change(in bps) |
| 12/06/2018 | 99.25 | 5.69% | 0 |
| 12/11/2018 | 99.00 | 5.72% | 0 |
| 23/04/2019 | 99.00 | 5.96% | 0 |
| 20/05/2019 | 100.00 | 6.00% | 0 |
| 28/11/2019 | 98.38 | 6.06% | 0 |
| 09/03/2020 | 100.13 | 6.33% | -9 |
| 14/04/2020 | 98.38 | 6.35% | -9 |
| 19/06/2020 | 99.25 | 6.39% | -8 |
| 12/04/2021 | 106.13 | 6.58% | -7 |
| 04/10/2022 | 97.13 | 6.71% | -5 |
| 27/01/2023 | 96.25 | 6.76% | -5 |
| 22/04/2024 | 98.25 | 6.96% | -7 |
| 04/11/2024 | 95.60 | 6.99% | -9 |
| 03/12/2024 | 100.00 | 7.00% | -6 |
| 26/02/2025 | 94.88 | 7.03% | -4 |
| 12/06/2025 | 95.00 | 7.04% | -4 |
| 28/11/2026 | 96.38 | 7.11% | -4 |
| 29/11/2027 | 97.00 | 7.15% | -3 |
| 03/11/2028 | 95.75 | 7.19% | -3 |
| 26/02/2030 | 95.13 | 7.23% | -1 |
| 22/04/2031 | 97.50 | 7.28% | -3 |
| 02/11/2035 | 97.00 | 7.35% | -4 |
| Last Price | Previous | % Change | Y-t-D | |
| $/LBP | 1,514.25 | 1,514.25 | – | |
| €/LBP | 1,581.52 | 1,565.39 | 1.03% | |
| £/LBP | 1,854.98 | 1,848.20 | 0.37% | |
| NEER | 118.78 | 118.78 | – | 0.32% |
Closing Date: 05 January 2017