
Discover today’s performance of BLOM indices, the closing prices of Lebanese stocks and Eurobonds, as well as the exchange rate of major currencies against the LBP.
BLOM Stock Index (BSI): Today’s Performance
| Last | Previous | % Change | Y-t-D Change | |
| BSI | 1,175.50 | 1,178.31 | -0.24% | -3.07% |
| High | 1,178.31 | 1,180.75 | ||
| Low | 1,171.65 | 1,169.92 | ||
| Volume | 67,794 | 192,464 | -64.78% | |
| Val ($) | 842,951 | 3,215,144 | -73.78% |
BLOM Preferred Shares Index (BPSI): Today’s Performance
| Last | Previous | Change | |
| BPSI | 104.99 | 104.91 | 0.08% |
| Volume | 6,000 | 26,615 | |
| Value | 600,590 | 2,625,695 |
Lebanese Stocks: Today’s Trades and Closing Prices
| Last Price ($) | % Change | Volume | Value | VWAP ($) | |
| Solidere A | 9.10 | -3.29% | 6,336 | 57,851 | 9.13 |
| Solidere B | 9.19 | 2.00% | 3,774 | 34,659 | 9.18 |
| Bank Audi GDR | 6.35 | -1.85% | 1,110 | 7,049 | 6.35 |
| Byblos Bank Listed | 1.62 | 0.00% | 44,237 | 71,664 | 1.62 |
| Byblos Bank Pref 2008 | 100.50 | 0.20% | 500 | 50,250 | 100.50 |
| Byblos Bank Pref 2009 | 100.70 | 0.50% | 500 | 50,340 | 100.68 |
| BEMO Pref. 2013 | 100.00 | 0.25% | 5,000 | 500,000 | 100.00 |
| BLOM Bank Listed | 10.76 | 0.47% | 3,440 | 37,019 | 10.76 |
| BLOM GDR | 11.70 | 0.00% | 2,000 | 23,400 | 11.70 |
| HOLCIM Liban | 11.95 | 0.42% | 897 | 10,719 | 11.95 |
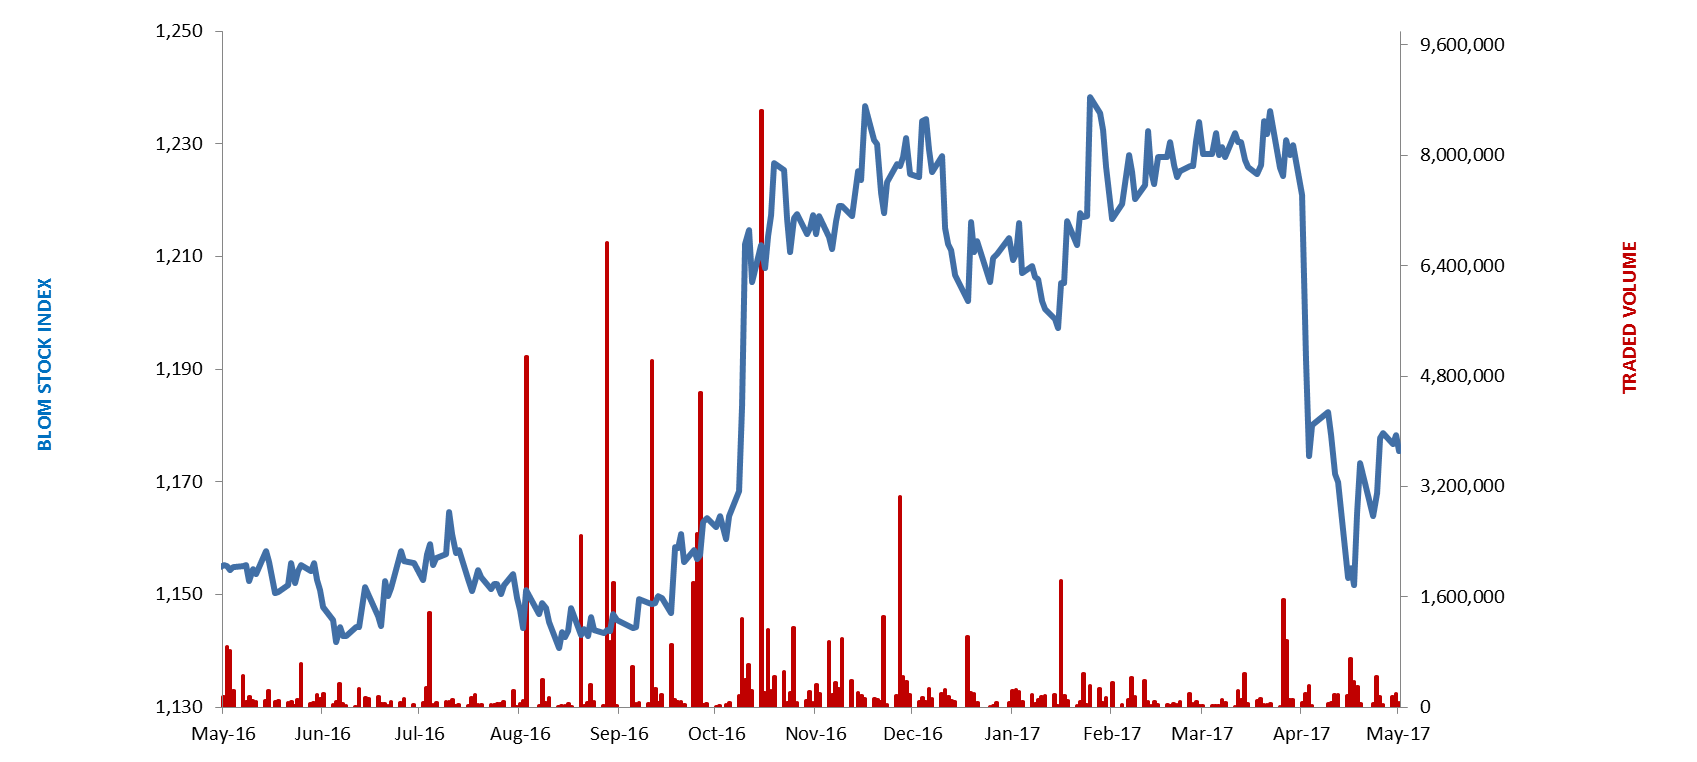
The BLOM Stock Index
Lebanese Global Depository Receipts: Last session’s Performance
| GDRs | Last Price ($) | Previous Price ($) | % Change | Volume | Value ($) |
| BLOM GDR | 11.70 | 11.70 | – | – | – |
| Audi GDR | 6.35 | 6.35 | – | – | – |
| Byblos GDR | 82.00 | 82.00 | – | – | – |
| Solidere GDR | 9.25 | 9.25 | – | 4,710 | 43,568 |
Source: Reuters
Closing Date: 9 May 2017
BLOM BOND INDEX: Last Session’s Performance
| Last | Previous | Change | Y-t-D Change | ||
| BBI | 106.465 | 106.468 | 0.00% | 4.48% | |
| Weighted Yield | 5.753% | 5.750% | 0.28 | bps | |
| Duration (Years) | 5.37 | 5.37 | |||
| 5Y Bond Yield | 5.44% | 5.43% | 1 | bps | |
| 5Y Spread* | 350 | 352 | -2 | bps | |
| 10Y Bond Yield | 6.54% | 6.56% | -2 | bps | |
| 10Y Spread* | 412 | 417 | -5 | bps | |
*between Lebanese Eurobonds and US Treasuries
Closing Date: 9 May 2017
Lebanese Eurobonds: Last Sessions’ Prices and Yields
| Price | Yield | Yield Change | |
| 12/06/2018 | 101.25 | 3.97% | 0 |
| 12/11/2018 | 101.50 | 4.11% | 0 |
| 23/04/2019 | 101.63 | 4.62% | 4 |
| 20/05/2019 | 102.63 | 4.63% | 3 |
| 28/11/2019 | 101.65 | 4.75% | 4 |
| 09/03/2020 | 103.75 | 4.94% | 0 |
| 14/04/2020 | 102.13 | 5.01% | 0 |
| 19/06/2020 | 103.00 | 5.09% | 0 |
| 12/04/2021 | 110.50 | 5.25% | 0 |
| 04/10/2022 | 102.65 | 5.52% | 2 |
| 27/01/2023 | 102.00 | 5.58% | 0 |
| 22/04/2024 | 103.00 | 6.11% | 0 |
| 04/11/2024 | 100.38 | 6.19% | 0 |
| 03/12/2024 | 104.75 | 6.20% | -2 |
| 26/02/2025 | 99.88 | 6.22% | -2 |
| 12/06/2025 | 100.00 | 6.25% | -4 |
| 28/11/2026 | 101.25 | 6.42% | 0 |
| 23/03/2027 | 102.25 | 6.54% | -2 |
| 29/11/2027 | 101.38 | 6.57% | -2 |
| 03/11/2028 | 100.38 | 6.60% | -2 |
| 26/02/2030 | 99.75 | 6.68% | 3 |
| 22/04/2031 | 101.25 | 6.86% | 0 |
| 23/03/2032 | 101.13 | 6.88% | 0 |
| 02/11/2035 | 100.25 | 7.03% | 0 |
| 23/03/2037 | 101.00 | 7.15% | 0 |
| Last Price | Previous | % Change | Y-t-D | |
| $/LBP | 1,514.25 | 1,514.25 | – | |
| €/LBP | 1,639.56 | 1,638.95 | 0.04% | |
| £/LBP | 1,952.66 | 1,949.65 | 0.15% | |
| NEER | 116.06 | 115.82 | 0.21% | -1.98% |
Closing Date: 10 May 2017