
Discover today’s performance of BLOM indices, the closing prices of Lebanese stocks and Eurobonds, as well as the exchange rate of major currencies against the LBP.
BLOM Stock Index (BSI): Today’s Performance
| Last | Previous | % Change | Y-t-D Change | |
| BSI | 1,172.78 | 1,173.65 | -0.07% | -3.29% |
| High | 1,174.09 | 1,173.65 | ||
| Low | 1,169.52 | 1,169.13 | ||
| Volume | 108,375 | 235,476 | -53.98% | |
| Val ($) | 1,668,411 | 3,238,691 | -48.49% |
BLOM Preferred Shares Index (BPSI): Today’s Performance
| Last | Previous | Change | |
| BPSI | 104.63 | 104.67 | -0.04% |
| Volume | 5,208 | 30,298 | |
| Value | 524,142 | 953,921 |
Lebanese Stocks: Today’s Trades and Closing Prices
| Last Price ($) | % Change | Volume | VWAP ($) | |
| Solidere A | 9.06 | 0.44% | 7,070 | 9.04 |
| Solidere B | 9.05 | 0.33% | 8,289 | 9.05 |
| Bank Audi Listed | 6.20 | 0.00% | 1,754 | 6.20 |
| Byblos Bank Listed | 1.61 | 0.00% | 1,370 | 1.61 |
| Byblos Bank Pref 2009 | 100.50 | -0.30% | 5,208 | 100.64 |
| BLOM Bank Listed | 11.00 | 0.00% | 25,000 | 11.00 |
| BLOM GDR | 12.00 | 0.42% | 53,801 | 11.96 |
| HOLCIM | 12.60 | 8.15% | 5,883 | 12.54 |
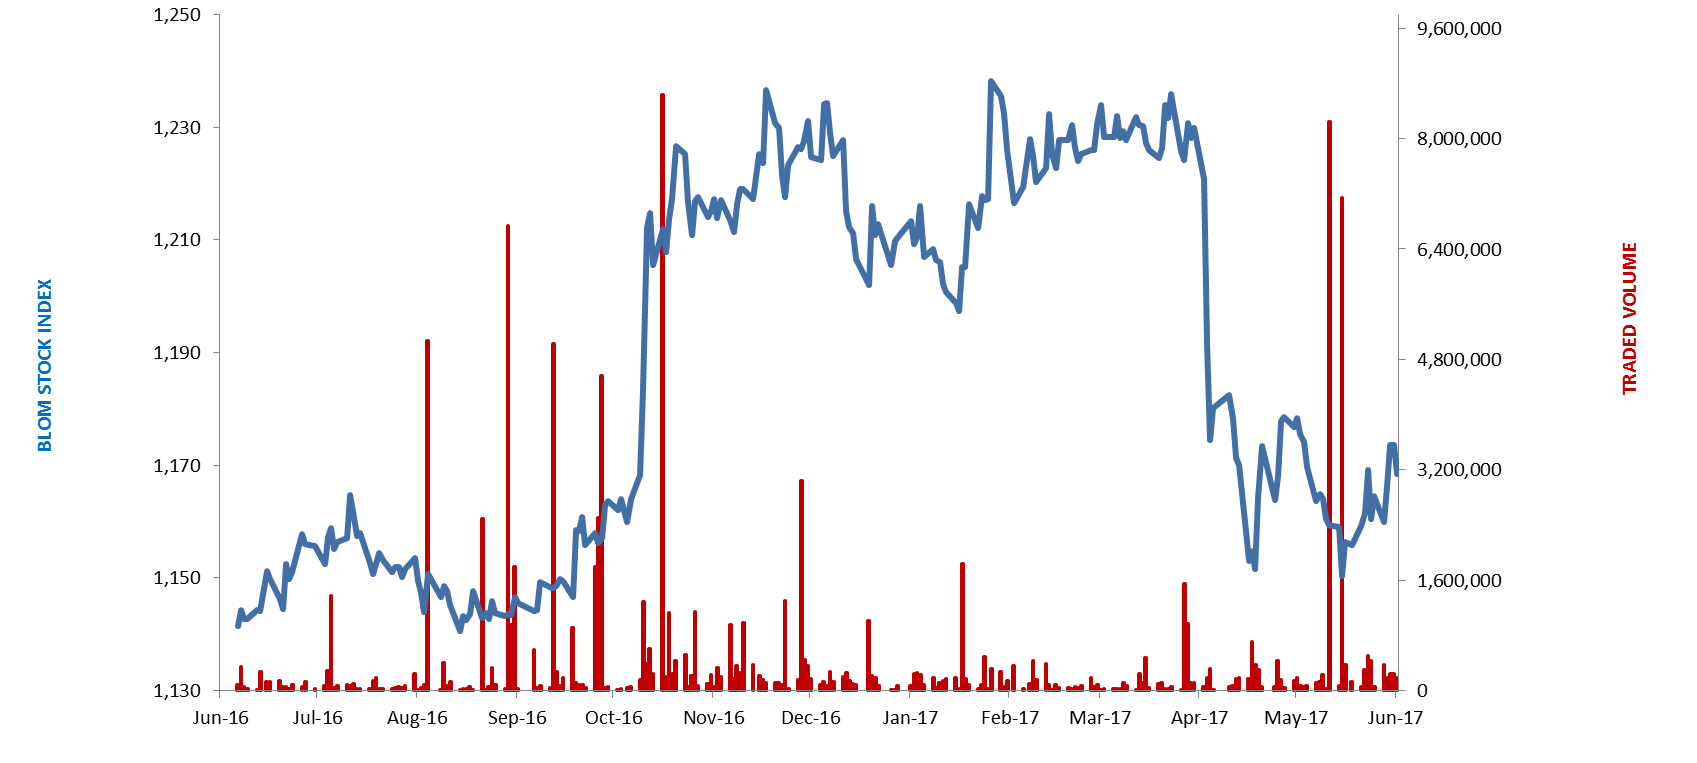
The BLOM Stock Index
Lebanese Global Depository Receipts: Last session’s Performance
| GDRs | Last Price ($) | Previous Price ($) | % Change | Volume | Value ($) |
| BLOM GDR | 11.9 | 11.9 | 0.0% | – | – |
| Audi GDR | 6.2 | 6.2 | 0.0% | 2,000 | 12,400 |
| Byblos GDR | 80 | 80 | 0.0% | – | – |
| Solidere GDR | 9.45 | 9.05 | 4.4% | 3,774 | 33,828.00 |
Source: Reuters
Closing Date: 13 June 2017
BLOM BOND INDEX: Last Session’s Performance
| Last | Previous | Change | Y-t-D Change | ||
| BBI | 105.64 | 105.71 | -0.07% | 3.67% | |
| Weighted Yield | 5.968% | 5.959% | 0.93 | bps | |
| Duration (Years) | 5.31 | 5.31 | |||
| 5Y Bond Yield | 5.77% | 5.77% | 0 | bps | |
| 5Y Spread* | 398 | 399 | -1 | bps | |
| 10Y Bond Yield | 6.64% | 6.61% | 3 | bps | |
| 10Y Spread* | 443 | 440 | 3 | bps | |
*between Lebanese Eurobonds and US Treasuries
Closing Date: 13 June 2017
Lebanese Eurobonds: Last Sessions’ Prices and Yields
| Price | Yield | Yield Change | |
| 12/06/2018 | 100.70 | 4.42% | 0 |
| 12/11/2018 | 100.88 | 4.50% | 0 |
| 23/04/2019 | 101.00 | 4.93% | 0 |
| 20/05/2019 | 101.88 | 4.97% | 0 |
| 28/11/2019 | 100.88 | 5.06% | 0 |
| 09/03/2020 | 102.50 | 5.38% | 0 |
| 14/04/2020 | 100.88 | 5.46% | 0 |
| 19/06/2020 | 101.75 | 5.51% | 0 |
| 12/04/2021 | 109.00 | 5.60% | 0 |
| 04/10/2022 | 101.25 | 5.82% | 0 |
| 27/01/2023 | 100.38 | 5.92% | 0 |
| 22/04/2024 | 102.00 | 6.28% | 3 |
| 04/11/2024 | 99.75 | 6.29% | 0 |
| 03/12/2024 | 104.00 | 6.32% | 2 |
| 26/02/2025 | 99.13 | 6.34% | 2 |
| 12/06/2025 | 99.25 | 6.37% | 2 |
| 28/11/2026 | 101.13 | 6.44% | 2 |
| 23/03/2027 | 101.50 | 6.64% | 3 |
| 29/11/2027 | 100.63 | 6.66% | 3 |
| 03/11/2028 | 99.63 | 6.70% | 2 |
| 26/02/2030 | 99.13 | 6.75% | 3 |
| 22/04/2031 | 101.25 | 6.86% | 0 |
| 23/03/2032 | 101.13 | 6.88% | 1 |
| 02/11/2035 | 100.38 | 7.01% | 0 |
| 23/03/2037 | 101.38 | 7.12% | 0 |
| Last Price | Previous | % Change | Y-t-D | |
| $/LBP | 1,514.25 | 1,514.25 | – | |
| €/LBP | 1,698.95 | 1,690.51 | 0.50% | |
| £/LBP | 1,928.85 | 1,922.06 | 0.35% | |
| NEER | 114.18 | 114.19 | -0.01% | -3.57% |
Closing Date: 14 June 2017