According to the Central Administration of Statistics (CAS), Lebanon’s average inflation rate climbed by a yearly 4.42% in H1 2017 as compared to an average deflation rate of 2.51% in H1 last year.
The average costs of “Housing” and “utilities (including: water, electricity, gas and other fuels)”, which grasped a combined 28.4% of the Consumer Price Index (CPI), rose by 6.35% year-on-year (y-o-y) by June 2017. In details,“Owner-occupied” rental costs constituted 13.6% of this category and increased by an annual 3.89%, while the average costs of “utilities” (11.8% of the Housing & utilities component), gained an annual 13.31% over the same period.
In turn, the average price indices for “Food and non-alcoholic beverages” (constituting 20% of the CPI) and “Education” costs (6.6% of CPI) registered yearly upticks of 3% and 2.68% in H1 2017. As for the average price for “Transportation” (grasping 13.1% of the CPI), it gained an annual 6.27% which can be attributed to the rise in the average international price of oil to $52.68/barrel in H1 2017 compared to $41.21/barrel in H1 last year. Nonetheless, average “Health” costs (7.7% of the CPI) slipped by 1.48% y-o-y over the same period.
It is worthy to mention that the jump recorded in the average costs of “Clothing and Footwear” (constituting 5.2% of the CPI), as well as in “Restaurants and Hotels” (2.8% of CPI) is highly correlated to the recovery seen in the Lebanese tourism sector. In fact, the number of tourists by May 2017 had registered a 12.81% yearly increase which also boosted tourist spending by 6% in H1 2017. As such, the average costs of “Restaurants and Hotels” component of the CPI rose by a yearly 1.88% in the same period. Moreover, noting that 70% of tourist expenditures were on “Fashion and Clothing” category in H1 2017, the corresponding “Clothing and footwear” CPI component climbed by an annual 7.89% by June 2017.
In June 2017, the CPI grew by 3.48% compared to June last year. The increase was driven by the annual upticks of 3.34% and 5.24% in the two largest CPI components “Housing and utilities” and “Food and non-alcoholic beverages”, but also by the revitalized tourism sector in June 2017 following Eid el Adha holiday. This last boosted the “Clothing and Footwear” component of the CPI by 12.25% y-o-y.
Across the Lebanese regions, the rise in inflation was reflected mostly in Beirut and the Bekaa. In Beirut, inflation rose by 0.22% and this is partly explained by 81% of total tourists’ spending in H1 2017 being concentrated in the capital. In the Bekaa region, inflation also registered a 0.33% monthly increase.
Average Inflation Rate in H1 2017
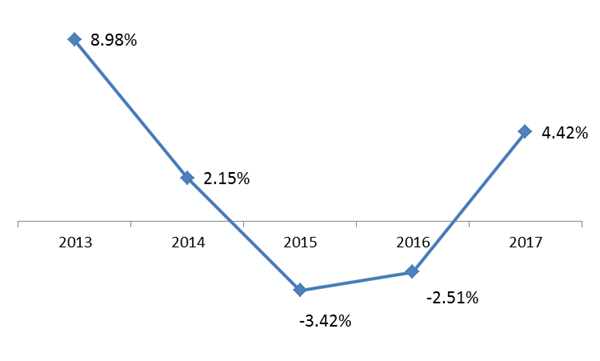
Source: CAS