
Discover today’s performance of BLOM indices, the closing prices of Lebanese stocks and Eurobonds, as well as the exchange rate of major currencies against the LBP.
BLOM Stock Index (BSI): Today’s Performance
| Last | Previous | % Change | Y-t-D Change | |
| BSI | 1,126.64 | 1,129.01 | -0.21% | -1.91% |
| High | 1,131.31 | 1,130.33 | ||
| Low | 1,126.31 | 1,126.48 | ||
| Volume | 151,503 | 92,477 | 63.83% | |
| Val ($) | 906,017 | 633,825 | 42.94% |
BLOM preferred Shares Index (BPSI): Today’s Performance
| Last | Previous | Change | |
| BPSI | 104.70 | 105.25 | -0.52% |
| Volume | 1,614 | 3,000 | |
| Value | 159,686 | 298,900 |
Lebanese Stocks: Today’s Trades and Closing Prices
| Last Price ($) | % Change | Volume | VWAP ($) | |
| Solidere A | 8.38 | -0.59% | 10,775 | 8.33 |
| Solidere B | 8.38 | 0.24% | 3,392 | 8.34 |
| Bank Audi Listed | 5.75 | 0.00% | 51,140 | 5.75 |
| Bank Audi GDR | 5.72 | -0.52% | 35,822 | 5.7 |
| Byblos Bank Listed | 1.5 | 0.00% | 43,339 | 1.5 |
| Byblos Bank Preferred 2008 | 98.9 | -1.10% | 1,000 | 98.9 |
| Byblos Bank Preferred 2009 | 99 | -1.00% | 614 | 99 |
| BLOM Bank Listed | 11.01 | -0.81% | 1,000 | 11.01 |
| BLOM Bank GDR | 11.5 | 0.79% | 3,514 | 11.5 |
| HOLCIM | 14.86 | 0.27% | 907 | 14.86 |
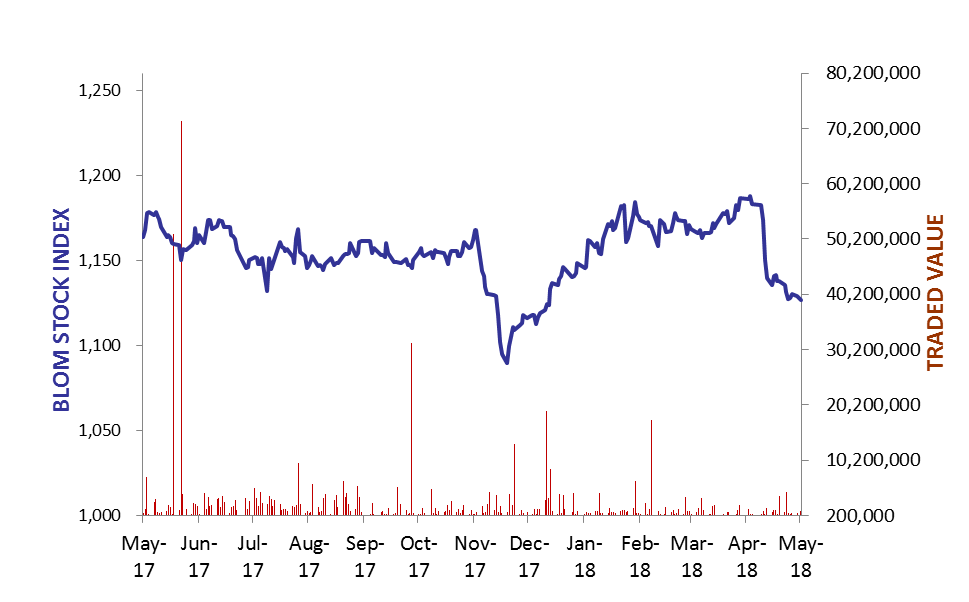
The BLOM Stock Index
Lebanese Global Depository Receipts: Last session’s Performance
| GDRs | Last Price ($) | Previous Price ($) | % Change | Volume | Value ($) |
| BLOM GDR | 11.4 | 11.5 | -0.9% | 41,665 | 477,251 |
| Audi GDR | 5.75 | 5.75 | 0.0% | – | – |
| Byblos GDR | 76.5 | 76.5 | 0.0% | – | – |
Source: London Stock Exchange
Closing Date: 30 April 2018
BLOM BOND INDEX: Last Session’s Performance
| Last | Previous | Change | Y-t-D Change | ||
| BBI | 98.04 | 96.70 | 1.39% | -2.99% | |
| Weighted Yield | 7.54% | 7.88% | -34 | bps | |
| Duration (Years) | 4.93 | 4.92 | |||
| 5Y Bond Yield | 7.32% | 7.75% | -43 | bps | |
| 5Y Spread* | 453 | 495 | -42 | bps | |
| 10Y Bond Yield | 8.23% | 8.51% | -28 | bps | |
| 10Y Spread* | 528 | 555 | -27 | bps | |
*between Lebanese Eurobonds and US Treasuries
Closing Date: 30 April 2018
Lebanese Eurobonds: Last Sessions’ Prices and Yields
| Price | Yield | Yield Change | |
| 23/04/2019 | 99.31 | 6.23% | -33 |
| 20/05/2019 | 99.75 | 6.24% | -36 |
| 28/11/2019 | 98.75 | 6.29% | -42 |
| 09/03/2020 | 99.75 | 6.51% | -51 |
| 14/04/2020 | 98.50 | 6.63% | -42 |
| 19/06/2020 | 98.88 | 6.72% | -38 |
| 12/04/2021 | 102.75 | 7.20% | -67 |
| 04/10/2022 | 95.25 | 7.38% | -35 |
| 27/01/2023 | 94.38 | 7.42% | -33 |
| 22/04/2024 | 95.13 | 7.68% | -16 |
| 04/11/2024 | 92.50 | 7.74% | -15 |
| 03/12/2024 | 96.00 | 7.79% | -15 |
| 26/02/2025 | 91.63 | 7.80% | -20 |
| 12/06/2025 | 91.38 | 7.85% | -20 |
| 28/11/2026 | 90.50 | 8.16% | -22 |
| 23/03/2027 | 91.50 | 8.21% | -30 |
| 29/11/2027 | 90.38 | 8.22% | -31 |
| 03/11/2028 | 88.75 | 8.27% | -28 |
| 26/02/2030 | 87.50 | 8.33% | -26 |
| 22/04/2031 | 89.50 | 8.34% | -26 |
| 23/03/2032 | 89.00 | 8.35% | -25 |
| 02/11/2035 | 88.00 | 8.37% | -24 |
| 23/03/2037 | 89.00 | 8.42% | -24 |
| Last Price | Previous | % Change | Y-t-D | |
| $/LBP | 1,514.25 | 1,514.25 | – | |
| €/LBP | 1,808.40 | 1,807.94 | 0.03% | |
| £/LBP | 2,056.38 | 2,052.46 | 0.19% | |
| NEER | 111.83 | 111.09 | 0.67% | 0.82% |
Closing Date: 01 May 2018