
Lebanon’s trade deficit dropped by 1.8% to $5.3B by April 2018 as a result of a 10.67% increase in exports to reach $1.1B which offset the marginal 0.14% increase in imports to $6.4B
In terms of imports, the mineral products with a weight of (17.24%) saw a decrease of 21.34% Year-On-Year (Y-O-Y) to stand at $1.1B by April 2018. Moreover, machinery and electrical instruments (11.5%) rose by 21.37% to reach $733M Y-O-Y. On the other hand, the vehicles, aircraft, vessels and transport equipment fell by 8.98% to $514M.
Lebanon imported products come from China (11%), Italy (9%), Greece (8%) and United States (6%).
In terms of exports, Pearls, precious stones and metals (27.36%) also increased by 30.22% to reach $293M. The Base metals and articles of base metals (14.09%) rose by 43.53% Y-O-Y to attain $151M. Contrariwise, prepared foodstuffs like beverage and tobacco (13.6%) saw a decrease by 6.39% to tick at $146M by April 2018.
Lebanon’s top export destinations are United Arab Emirates and South Africa with 12% and 10%, respectively of total exports value.
Lebanon’s trade deficit by April
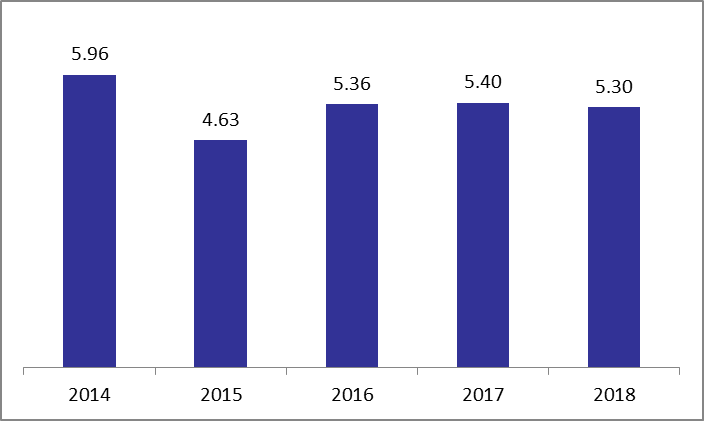
Source: Lebanese Customs