Lebanon’s trade deficit widened by 3.93% year-on-year (y-o-y) to $10.14B by July 2018 as a result of a 4.29% y-o-y increase in imports to $11.90B, which was outweighed by the 6.40% annual rise in exports to $1.76B.
In terms of imports, the mineral products with a weight of (21.75%) saw an annual increase of 0.64% y-o-y to stand at $2.59B by July 2018. Moreover, products of the chemical industries (11.18%) and machinery and electrical instruments (10.47%) rose by 8.54% and 9.67% to reach $1.33B and $1.25B, by July 2018.
Lebanon imported 10% of the products from China and 8% from each of Italy and the USA.
In terms of exports, Pearls, precious stones and metals (24.37%) also increased by 18.65% to reach $428.30M. The Base metals and articles of base metals (14.18%) rose by 34.37% y-o-y to $249.30M. On the contrary, prepared foodstuffs like beverage and tobacco (13.65%) saw a decrease by 11.94% to stand at $239.94M by July 2018.
Lebanon’s top export destinations are the United Arab Emirates and South Africa with shares of 13% and 9% of total exports value, respectively.
Lebanon’s trade deficit by July ($B)
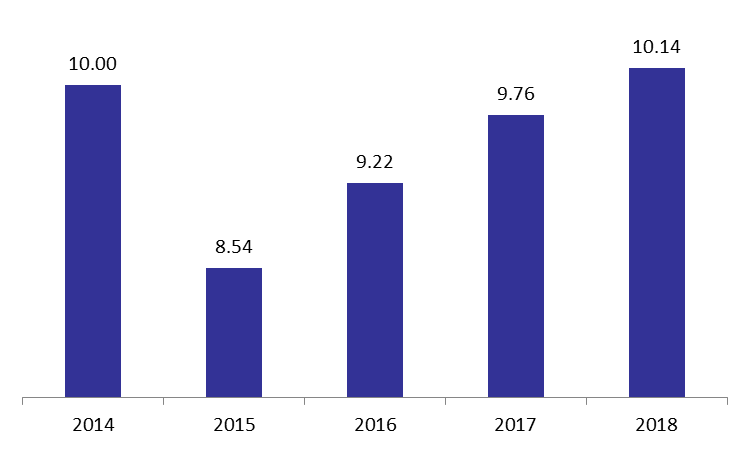
Source: Customs