According to Global Blue, tourist spending in Lebanon rose by 10.46% YTD, affecting positively the YTD- year-to-date growth rate that reached 6.45% by December 2017.
The number of refund transactions rose by 5.53% year-on-year by December 2018. In details, Q4 2018 witnessed a yearly growth of 16.75% and the highest increase in this quarter was executed during the month of November that recorded a rise of 31.49% in the number of refund transactions while the lowest growth rate was recorded during December and reached 22.09%.
Tourists from the Arab countries remained the largest spenders in Lebanon, with Saudis, Emiratis, Syrians, and Kuwaitis, in particular, grasping shares of 12%, 11%, 10% and 7% of total spending, respectively.
On a yearly basis; tourist spending by Syrians, Qatari and Egyptians rose by 64.71%, 60.47%, and 25.93%, respectively. Meanwhile, spending by Canadians and Saudi Arabian visitors fell by 20.59% and 15.05% respectively.
In 2018, tourists expended 67% of their total spending on Fashion and clothing, followed by 18% on Watches and jewelry, noting that spending on Fashion and clothing grew 2.86% in 2018 and spending on watches and jewelry grew by 21.4% in 2018.
It is worthy to note that the capital Beirut maintained its first place with 81% of total tourist expenditures by December 2018, while the Metn and Baabda areas grasped 13% and 3%, respectively. In details, Tourists’ spending in Beirut added a yearly 7.84% and declined by 4.88% and 0.46% in Baabda and Metn respectively.
Spending evolution –YTD vs. PYTD by Areas
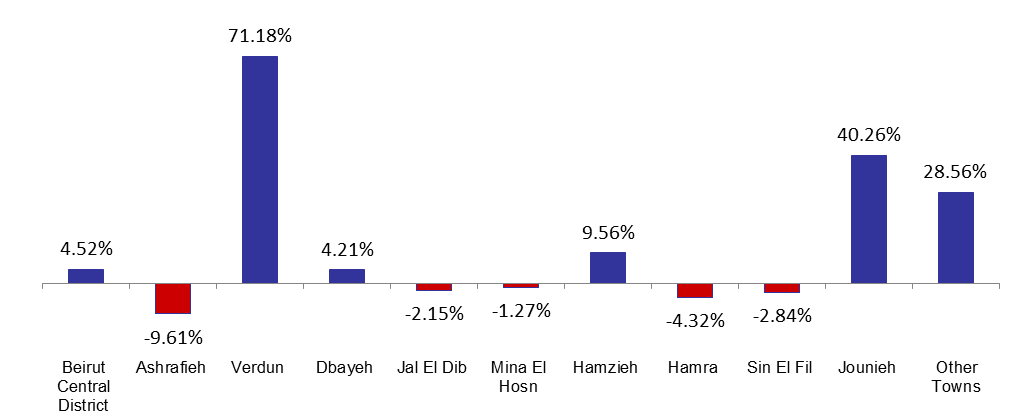
Source: Global Blue Tourist Spending Report