Discover today’s performance of BLOM indices, the closing prices of Lebanese stocks and Eurobonds, as well as the exchange rate of major currencies against the LBP.
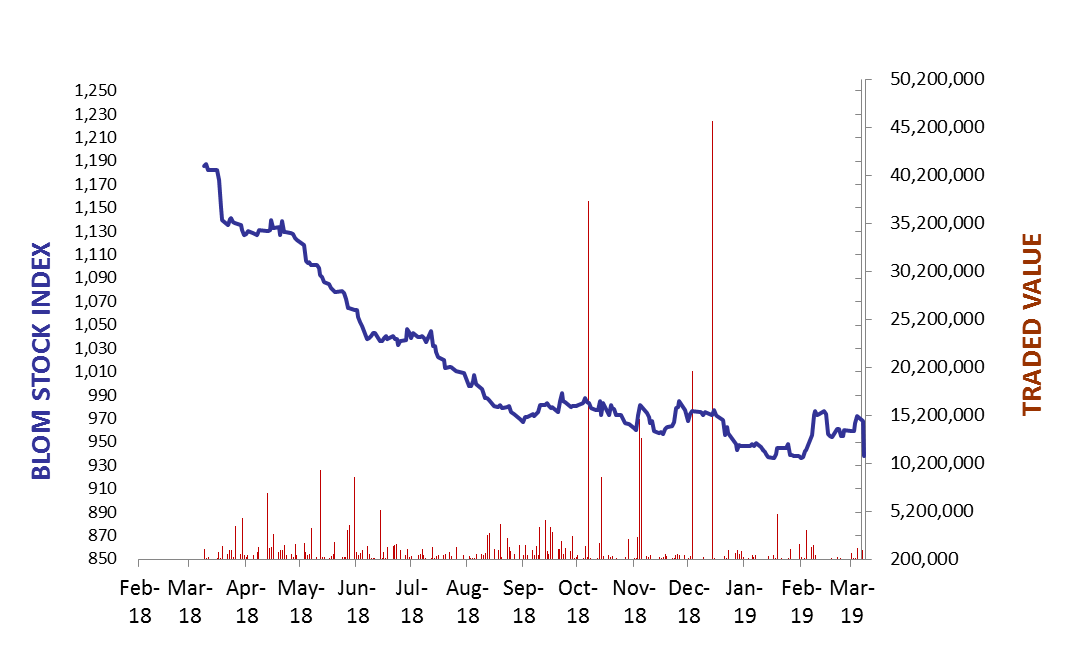
BLOM Stock Index (BSI) – today’s performance
| Last | Previous | % Change | Y-t-D Change | |
| BSI | 967.91 | 968.13 | -0.02% | -0.89% |
| High | 968.10 | 972.70 | ||
| Low | 966.70 | 968.13 | ` | |
| Volume | 6,822 | 70,398 | ||
| Val ($) | 63,842 | 1,211,423 |
I): Today’s Performance
BLOM preferred Shares Index (BPSI): today’s Performance
| Last | Previous | Change | |
| BPSI | 86.97 | 86.48 | 0.57% |
| Volume | 50 | 11,240 | |
| Value | 3,800 | 1,009,352 |
Lebanese Stocks: today’s Trades and Closing Prices
| Last Price ($) | % Change | Volume | VWAP ($) | |
| Solidere B | 5.84 | -3.47% | 5 | 5.84 |
| Byblos Bank – Listed Shares | 1.36 | 0.00% | 2,767 | 1.36 |
| Byblos Bank Pref 2009 | 76 | 5.56% | 50 | 76 |
| BLOM GDR | 9.75 | 0.00% | 1,000 | 9.75 |
| HOLCIM | 15.5 | 1.17% | 3,000 | 15.5 |
The BLOM Stock Index
Lebanese Global Depository Receipts: Last session’s Performance
| GDRs | Last Price ($) | Previous Price ($) | % Change | Volume | Value ($) |
| BLOM GDR | 9.8 | 9.75 | 0.51% | 38,499 | 376,781 |
| Audi GDR | 5 | 5 | 0.00% | 5,169 | 25,845 |
| Byblos GDR | 77 | 77 | 0.00% | – |
Closing Date: 01 April 2019
Source: London Stock Exchange
BLOM BOND INDEX: Last Session’s Performance
| Last | Previous | Change | Y-t-D Change | ||
| BBI | 89.98 | 89.47 | 0.573% | -10.96% | |
| Weighted Yield | 10.50% | 10.64% | -14 | bps | |
| Duration (Years) | 4.73 | 4.72 | |||
| 5Y Bond Yield | 10.68% | 10.79% | -11 | bps | |
| 5Y Spread* | 839 | 858 | -19 | bps | |
| 10Y Bond Yield | 10.34% | 10.43% | -9 | bps | |
| 10Y Spread* | 794 | 812 | -18 | bps | |
*between Lebanese Eurobonds and US Treasuries
Closing Date: 01 April 2019
Lebanese Eurobonds: Last Sessions’ Prices and Yields
| Price | Yield | Yield Change | |
| 09/03/2020 | 96.77 | 10.06% | -30 |
| 14/04/2020 | 95.36 | 10.64% | -9 |
| 19/06/2020 | 94.96 | 10.66% | -8 |
| 12/04/2021 | 93.90 | 11.71% | -23 |
| 04/10/2022 | 87.00 | 10.64% | -13 |
| 27/01/2023 | 85.61 | 10.68% | -12 |
| 22/04/2024 | 84.46 | 10.71% | -13 |
| 04/11/2024 | 82.20 | 10.54% | -12 |
| 03/12/2024 | 84.05 | 10.83% | -11 |
| 26/02/2025 | 82.09 | 10.33% | -15 |
| 12/06/2025 | 82.59 | 10.09% | -30 |
| 28/11/2026 | 80.54 | 10.34% | -14 |
| 23/03/2027 | 80.90 | 10.44% | -11 |
| 29/11/2027 | 79.82 | 10.33% | -9 |
| 03/11/2028 | 78.85 | 10.15% | -9 |
| 26/02/2030 | 77.01 | 10.19% | -9 |
| 22/04/2031 | 77.12 | 10.37% | -10 |
| 23/03/2032 | 78.37 | 10.01% | -10 |
| 02/11/2035 | 76.99 | 9.90% | -7 |
| 23/03/2037 | 77.42 | 9.98% | -10 |
Lebanese Forex Market
| Last Price | Previous | % Change | Y-t-D | |
| $/LBP | 1,514.25 | 1,514.25 | – | |
| €/LBP | 1,689.46 | 1,688.85 | 0.04% | |
| £/LBP | 1,965.48 | 1,974.67 | -0.47% | |
| NEER | 118.41 | 118.31 | 0.09% |
Closing Date: 02 April 2019