Discover today’s performance of BLOM indices, the closing prices of Lebanese stocks and Eurobonds, as well as the exchange rate of major currencies against the LBP.
BLOM Stock Index (BSI) – today’s performance
| Last | Previous | % Change | Y-t-D Change | |
| BSI | 870.43 | 872.75 | -0.27% | -10.65% |
| High | 873.00 | 876.40 | ||
| Low | 863.50 | 871.30 | ` | |
| Volume | 61,571 | 36,024 | ||
| Val ($) | 311,698 | 194,954 |
I): BLOM preferred Shares Index (BPSI): today’s Performance
| Last | Previous | Change | |
| BPSI | 85.61 | 85.61 | 0.00% |
| Volume | 500 | ||
| Value | 36,000 |
Lebanese Stocks: today’s Trades and Closing Prices
| Last Price ($) | % Change | Volume | VWAP ($) | |
| Solidere A | 5 | 0.60% | 6,355 | 4.99 |
| Solidere B | 4.96 | 4.86% | 5,808 | 4.84 |
| Bank Audi | 4.44 | -1.99% | 17,500 | 4.44 |
| Bank Audi GDR | 4.3 | -2.27% | 13,657 | 4.3 |
| Byblos Bank – Listed Shares | 1.26 | 0.00% | 4,523 | 1.26 |
| BLOM GDR | 8 | 1.27% | 13,728 | 8 |
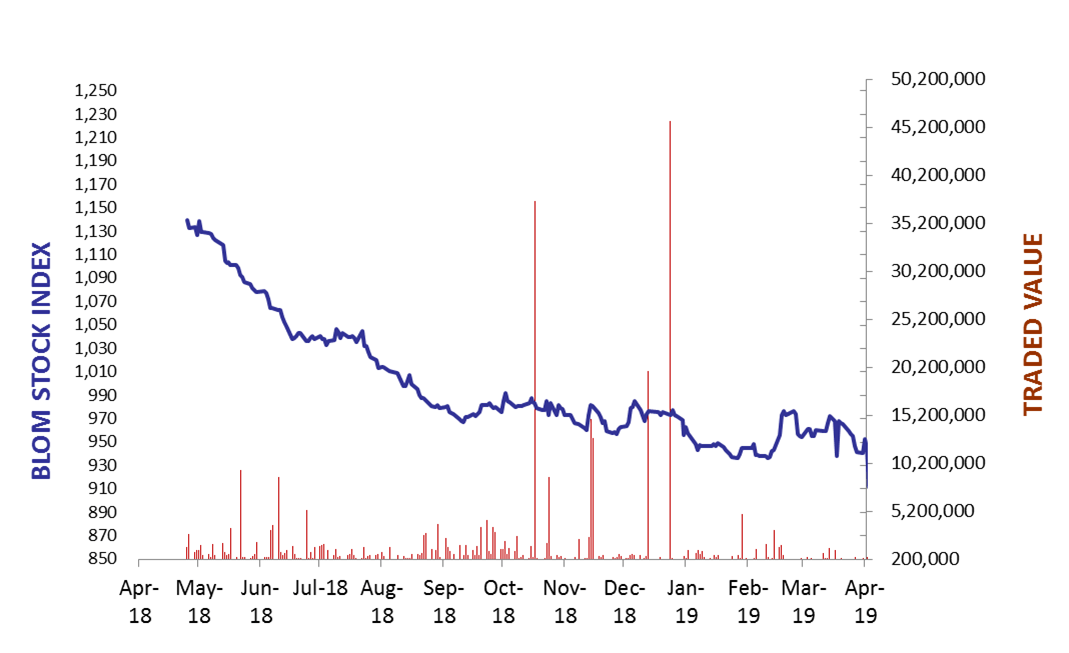
The BLOM Stock Index
Lebanese Global Depository Receipts: Last session’s Performance
| GDRs | Last Price ($) | Previous Price ($) | % Change | Volume | Value ($) |
| BLOM GDR | 8.0 | 8.0 | 0.00% | 1,734 | 13,697 |
| Audi GDR | 4.4 | 4.4 | 0.00% | ||
| Byblos GDR | 77 | 77 | 0.00% | – | – |
Closing Date: 09 May 2019
Source: London Stock Exchange
BLOM BOND INDEX: Last Session’s Performance
| Last | Previous | Change | Y-t-D Change | ||
| BBI | 90.16 | 90.52 | -0.389% | -10.78% | |
| Weighted Yield | 10.42% | 10.34% | 8 | bps | |
| Duration (Years) | 4.67 | 4.68 | |||
| 5Y Bond Yield | 10.91% | 10.87% | 4 | bps | |
| 5Y Spread* | 869 | 861 | 8 | bps | |
| 10Y Bond Yield | 10.50% | 10.40% | 10 | bps | |
| 10Y Spread* | 816 | 802 | 14 | bps | |
*between Lebanese Eurobonds and US Treasuries
Closing Date: 09 May 2019
Lebanese Eurobonds: Last Sessions’ Prices and Yields
| Price | Yield | Yield Change | |
| 09/03/2020 | 97.44 | 9.63% | -18 |
| 14/04/2020 | 96.45 | 9.89% | 11 |
| 19/06/2020 | 96.01 | 10.04% | -3 |
| 12/04/2021 | 95.83 | 10.70% | 15 |
| 04/10/2022 | 86.77 | 10.85% | 10 |
| 27/01/2023 | 84.98 | 11.04% | 6 |
| 22/04/2024 | 83.64 | 11.04% | 13 |
| 04/11/2024 | 81.70 | 10.77% | 11 |
| 03/12/2024 | 84.14 | 10.91% | 4 |
| 26/02/2025 | 81.29 | 10.61% | 9 |
| 12/06/2025 | 81.99 | 10.31% | 12 |
| 28/11/2026 | 80.22 | 10.46% | 12 |
| 23/03/2027 | 80.20 | 10.63% | 12 |
| 29/11/2027 | 79.25 | 10.49% | 10 |
| 03/11/2028 | 78.37 | 10.29% | 10 |
| 26/02/2030 | 76.93 | 10.23% | 9 |
| 22/04/2031 | 77.09 | 10.42% | 3 |
| 23/03/2032 | 79.17 | 9.90% | 6 |
| 02/11/2035 | 76.74 | 9.97% | 8 |
| 23/03/2037 | 77.22 | 10.02% | 8 |
Lebanese Forex Market
| Last Price | Previous | % Change | Y-t-D | |
| $/LBP | 1,514.25 | 1,514.25 | – | |
| €/LBP | 1,692.77 | 1,691.42 | 0.08% | |
| £/LBP | 1,961.41 | 1,961.71 | -0.02% | |
| NEER | 119.46 | 119.89 | -0.36% |
Closing Date: 09 May 2019