Discover today’s performance of BLOM indices, the closing prices of Lebanese stocks and Eurobonds, as well as the exchange rate of major currencies against the LBP.
BLOM Stock Index (BSI) – today’s performance
| Last | Previous | % Change | Y-t-D Change | |
| BSI | 866.32 | 866.35 | 0.00% | -11.31% |
| High | 867.20 | 870.40 | ||
| Low | 854.30 | 866.30 | ` | |
| Volume | 54,046 | 49,873 | ||
| Val ($) | 288,046 | 219,860 |
I): BLOM preferred Shares Index (BPSI): today’s Performance
| Last | Previous | Change | |
| BPSI | 85.01 | 85.01 | 0.00% |
| Volume | – | – | |
| Value | – | – |
Lebanese Stocks: today’s Trades and Closing Prices
| Last Price ($) | % Change | Volume | VWAP ($) | |
| Solidere A | 5.09 | -1.93% | 25,553 | 5.07 |
| Solidere B | 5.02 | -6.86% | 12,792 | 5.04 |
| Bank Audi | 4.24 | 0.95% | 5,887 | 4.24 |
| Byblos Bank – Listed Shares | 1.25 | 2.46% | 156 | 1.25 |
| BLOM GDR | 7.7 | 0.00% | 8,555 | 7.7 |
| CB (N) | 2.7 | 3.45% | 1,103 | 2.7 |
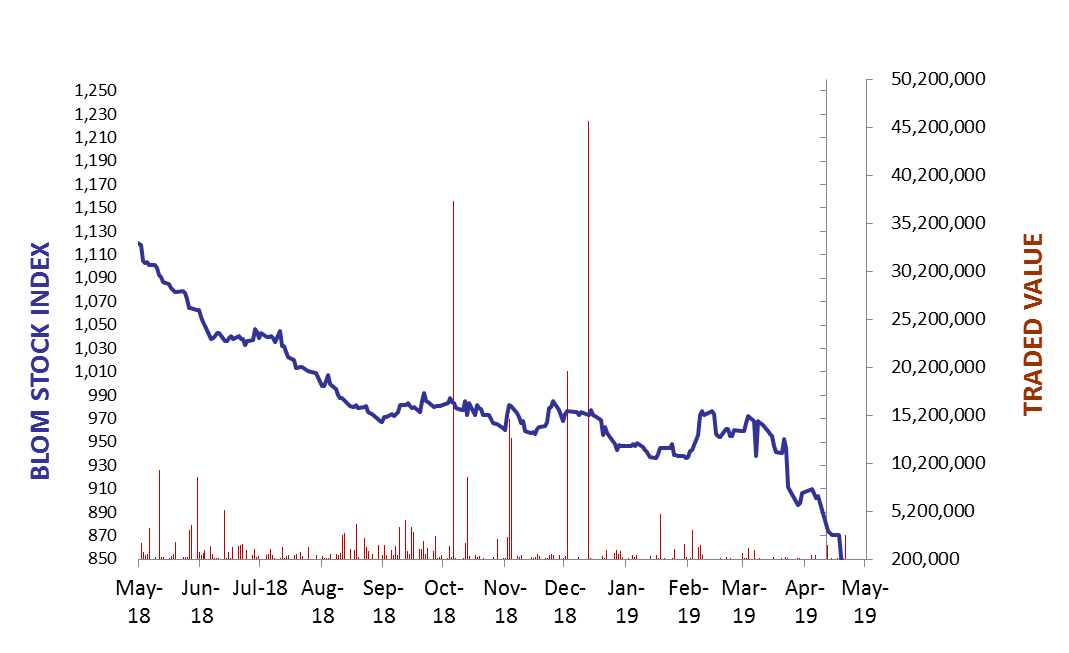
The BLOM Stock Index
Lebanese Global Depository Receipts: Last session’s Performance
| GDRs | Last Price ($) | Previous Price ($) | % Change | Volume | Value ($) |
| BLOM GDR | 7.75 | 7.7 | 0.65% | 6,849 | 53,025 |
| Audi GDR | 4.3 | 4.3 | 0.00% | – | – |
| Byblos GDR | 77 | 77 | 0.00% | – | – |
Closing Date: 24 May 2019
Source: London Stock Exchange
BLOM BOND INDEX: Last Session’s Performance
| Last | Previous | Change | Y-t-D Change | ||
| BBI | 89.34 | 89.32 | 0.02% | -11.60% | |
| Weighted Yield | 10.87% | 10.87% | 0 | bps | |
| Duration (Years) | 5.18 | 5.19 | |||
| 5Y Bond Yield | 11.43% | 11.45% | -2 | bps | |
| 5Y Spread* | 933 | 935 | -2 | bps | |
| 10Y Bond Yield | 10.80% | 10.80% | 0 | bps | |
| 10Y Spread* | 858 | 858 | 0 | bps | |
*between Lebanese Eurobonds and US Treasuries
Closing Date: 27 May 2019
Lebanese Eurobonds: Last Sessions’ Prices and Yields
| Price | Yield | Yield Change | |
| 12/04/2021 | 95.46 | 10.98% | -5 |
| 04/10/2022 | 85.55 | 11.40% | 1 |
| 27/01/2023 | 83.91 | 11.50% | 1 |
| 22/04/2024 | 82.08 | 11.53% | 1 |
| 04/11/2024 | 80.19 | 11.21% | 1 |
| 03/12/2024 | 82.29 | 11.41% | 1 |
| 26/02/2025 | 79.83 | 11.03% | 1 |
| 12/06/2025 | 80.38 | 10.75% | 1 |
| 28/11/2026 | 78.96 | 10.76% | 0 |
| 23/03/2027 | 79.01 | 10.90% | 0 |
| 29/11/2027 | 77.86 | 10.79% | 0 |
| 03/11/2028 | 77.44 | 10.47% | 0 |
| 26/02/2030 | 74.95 | 10.61% | 0 |
| 22/04/2031 | 75.67 | 10.65% | 0 |
| 23/03/2032 | 78.11 | 10.08% | 0 |
| 02/11/2035 | 75.21 | 10.19% | 0 |
| 23/03/2037 | 75.88 | 10.21% | 0 |
Lebanese Forex Market
| Last Price | Previous | % Change | Y-t-D | |
| $/LBP | 1,514.25 | 1,514.25 | – | |
| €/LBP | 1,686.29 | 1,687.80 | -0.09% | |
| £/LBP | 1,909.55 | 1,911.06 | -0.08% | |
| NEER | 119.60 | 119.53 | 0.06% |
Closing Date: 28 May 2019