Discover today’s performance of BLOM indices, the closing prices of Lebanese stocks and Eurobonds, as well as the exchange rate of major currencies against the LBP.
BLOM Stock Index (BSI) – today’s performance
| Last | Previous | % Change | Y-t-D Change | |
| BSI | 855.92 | 858.31 | -0.28% | -12.13% |
| High | 858.30 | 858.75 | ||
| Low | 855.60 | 856.20 | ` | |
| Volume | 81,238 | 24,513 | ||
| Val ($) | 545,165 | 264,150 |
I): BLOM preferred Shares Index (BPSI): today’s Performance
| Last | Previous | Change | |
| BPSI | 84.89 | 84.86 | 0.04% |
| Volume | 9,000 | 1,000 | |
| Value | 225,000 | 93,000 |
Lebanese Stocks: today’s Trades and Closing Prices
| Last Price ($) | % Change | Volume | VWAP ($) | |
| Solidere A | 5.05 | -1.17% | 9,900 | 5.03 |
| Solidere B | 5.03 | -0.98% | 8,503 | 5.07 |
| Bank Audi | 4 | 0.00% | 51,311 | 4 |
| Bank of Beirut – Pref H | 25 | 0.40% | 6,400 | 25 |
| Bank of Beirut – Pref J | 25 | 0.00% | 2,600 | 25 |
| BLOM – Listed | 8.5 | -0.58% | 1,000 | 8.5 |
| BLOM GDR | 7.7 | 0.00% | 1,250 | 7.7 |
| HOLCIM | 14.1 | -1.40% | 274 | 14.1 |
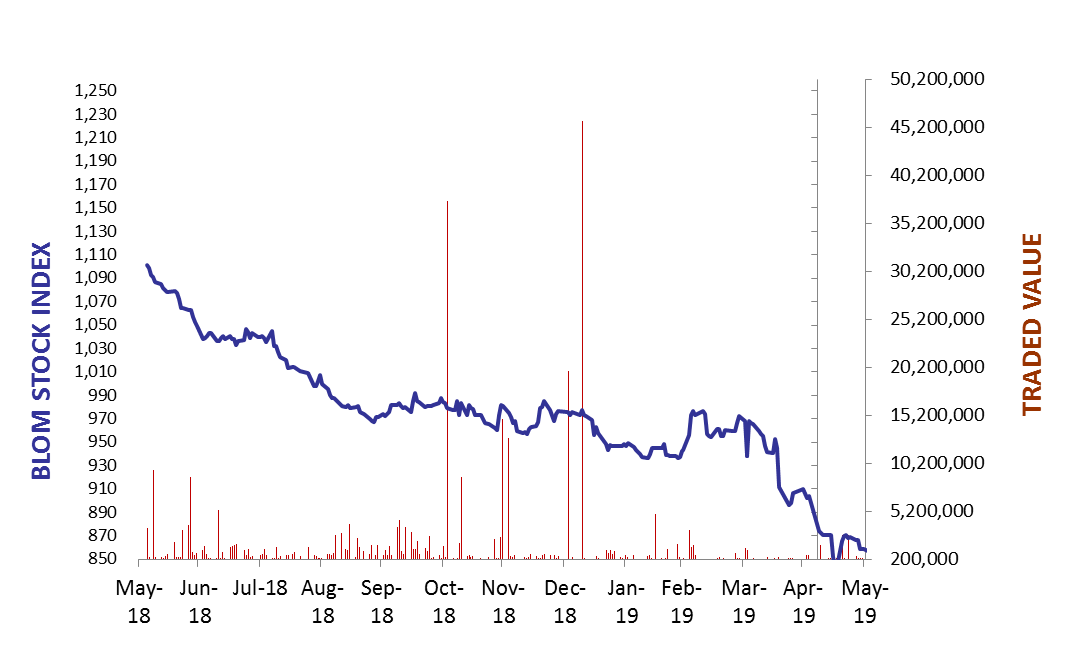
The BLOM Stock Index
Lebanese Global Depository Receipts: Last session’s Performance
| GDRs | Last Price ($) | Previous Price ($) | % Change | Volume | Value ($) |
| BLOM GDR | 7.45 | 7.8 | -4.49% | 21,063 | 159,939 |
| Audi GDR | 4 | 4 | 0.00% | – | – |
| Byblos GDR | 77 | 77 | 0.00% | – | – |
Closing Date: 31 May 2019
Source: London Stock Exchange
BLOM BOND INDEX: Last Session’s Performance
| Last | Previous | Change | Y-t-D Change | ||
| BBI | 88.07 | 88.78 | -0.81% | -12.86% | |
| Weighted Yield | 11.19% | 11.01% | 18 | bps | |
| Duration (Years) | 5.19 | 5.20 | |||
| 5Y Bond Yield | 11.75% | 11.53% | 22 | bps | |
| 5Y Spread* | 985 | 953 | 32 | bps | |
| 10Y Bond Yield | 11.15% | 10.92% | 23 | bps | |
| 10Y Spread* | 912 | 880 | 32 | bps | |
*between Lebanese Eurobonds and US Treasuries
Closing Date: 31 May 2019
Lebanese Eurobonds: Last Sessions’ Prices and Yields
| Price | Yield | Yield Change | |
| 12/04/2021 | 94.66 | 11.50% | 26 |
| 04/10/2022 | 84.88 | 11.69% | 18 |
| 27/01/2023 | 83.07 | 11.83% | 20 |
| 22/04/2024 | 81.12 | 11.84% | 19 |
| 04/11/2024 | 79.13 | 11.53% | 17 |
| 03/12/2024 | 81.71 | 11.59% | 9 |
| 26/02/2025 | 78.59 | 11.38% | 19 |
| 12/06/2025 | 79.25 | 11.05% | 16 |
| 28/11/2026 | 77.66 | 11.06% | 17 |
| 23/03/2027 | 77.65 | 11.22% | 18 |
| 29/11/2027 | 76.47 | 11.10% | 16 |
| 03/11/2028 | 75.97 | 10.77% | 20 |
| 26/02/2030 | 73.47 | 10.90% | 16 |
| 22/04/2031 | 74.42 | 10.88% | 11 |
| 23/03/2032 | 76.57 | 10.34% | 19 |
| 02/11/2035 | 73.75 | 10.42% | 9 |
| 23/03/2037 | 74.39 | 10.44% | 14 |
Lebanese Forex Market
| Last Price | Previous | % Change | Y-t-D | |
| $/LBP | 1,514.25 | 1,514.25 | – | |
| €/LBP | 1,688.70 | 1,683.43 | 0.31% | |
| £/LBP | 1,905.93 | 1,904.12 | 0.10% | |
| NEER | 119.21 | 119.43 | -0.18% |
Closing Date: 03 June 2019