Discover today’s performance of BLOM indices, the closing prices of Lebanese stocks and Eurobonds, as well as the exchange rate of major currencies against the LBP.
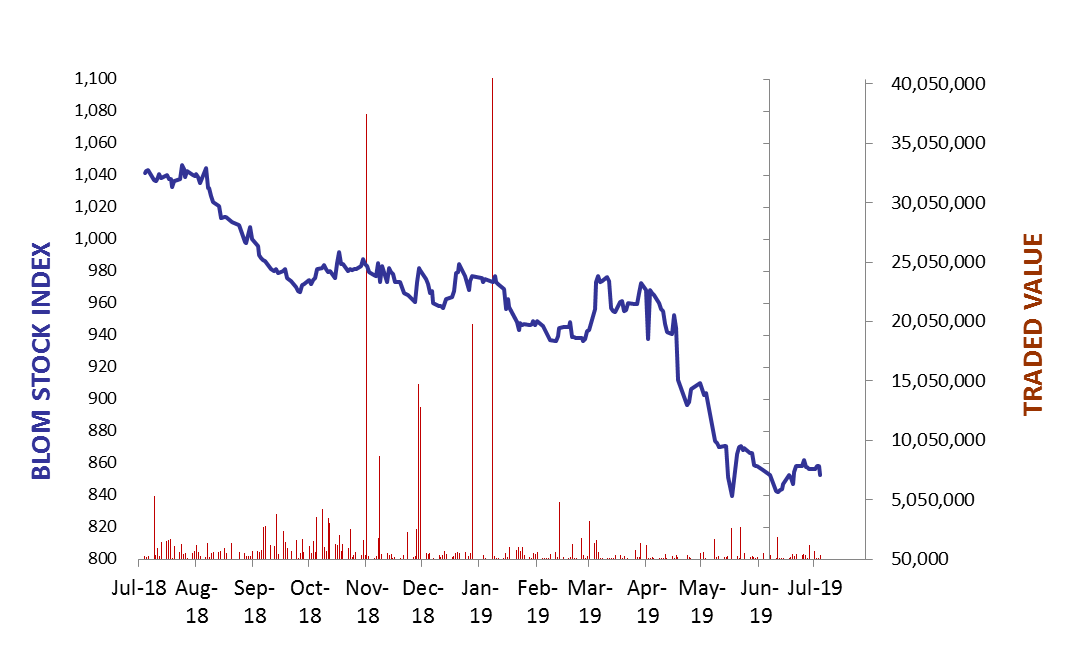
BLOM Stock Index (BSI) – today’s performance
| Last | Previous | % Change | Y-t-D Change | |
| BSI | 852.55 | 858.27 | -0.67% | -12.72% |
| High | 860.20 | 860.20 | ||
| Low | 856.00 | 856.00 | ` | |
| Volume | 35,414 | 23,782 | ||
| Val ($) | 373,342 | 163,987 |
I): BLOM preferred Shares Index (BPSI): today’s Performance
| Last | Previous | Change | |
| BPSI | 83.06 | 83.33 | -0.32% |
| Volume | 2,500 | ||
| Value | 167,000 |
Lebanese Stocks: today’s Trades and Closing Prices
| Last Price ($) | % Change | Volume | VWAP ($) | |
| Solidere A | 6.49 | -3.13% | 10,718 | 6.41 |
| Solidere B | 6.51 | -1.81% | 12,193 | 6.49 |
| Bank Audi GDR | 3.9 | -2.50% | 7,850 | 3.90 |
| Byblos Bank Pref 2008 | 66.8 | -3.19% | 2,500 | 66.80 |
| HOLCIM | 12.96 | -4.00% | 2,153 | 12.96 |
The BLOM Stock Index
Lebanese Global Depository Receipts: Last session’s Performance
| GDRs | Last Price ($) | Previous Price ($) | % Change | Volume | Value ($) |
| BLOM GDR | 7.4 | 7.4 | 0.00% | 76,119 | 563,281 |
| Audi GDR | 3.96 | 3.96 | 0.00% | ||
| Byblos GDR | 77 | 77 | 0.00% | – | – |
Closing Date: 03 July 2019
Source: London Stock Exchange
BLOM BOND INDEX: Last Session’s Performance
| Last | Previous | Change | Y-t-D Change | ||
| BBI | 91.25 | 90.81 | 0.49% | -9.71% | |
| Weighted Yield | 10.57% | 10.69% | -11 | bps | |
| Duration (Years) | 5.17 | 5.17 | |||
| 5Y Bond Yield | 11.07% | 11.23% | -16 | bps | |
| 5Y Spread* | 936 | 952 | -16 | bps | |
| 10Y Bond Yield | 10.39% | 10.50% | -11 | bps | |
| 10Y Spread* | 856 | 865 | -9 | bps | |
*between Lebanese Eurobonds and US Treasuries
Closing Date: 03 July 2019
Lebanese Eurobonds: Last Sessions’ Prices and Yields
| Price | Yield | Yield Change | |
| 12/04/2021 | 94.88 | 11.50% | -19 |
| 04/10/2022 | 86.67 | 11.09% | -17 |
| 27/01/2023 | 85.50 | 11.02% | -17 |
| 22/04/2024 | 83.58 | 11.15% | -8 |
| 04/11/2024 | 81.46 | 10.92% | -7 |
| 03/12/2024 | 83.58 | 11.11% | -9 |
| 26/02/2025 | 81.33 | 10.68% | -11 |
| 12/06/2025 | 81.88 | 10.42% | -11 |
| 28/11/2026 | 80.92 | 10.35% | -10 |
| 23/03/2027 | 81.21 | 10.45% | -12 |
| 29/11/2027 | 80.04 | 10.36% | -12 |
| 03/11/2028 | 80.09 | 9.97% | -8 |
| 26/02/2030 | 78.92 | 9.89% | -6 |
| 22/04/2031 | 78.30 | 10.20% | -6 |
| 23/03/2032 | 79.96 | 9.79% | -6 |
| 02/11/2035 | 77.96 | 9.78% | -6 |
| 23/03/2037 | 78.96 | 9.78% | -6 |
Lebanese Forex Market
| Last Price | Previous | % Change | Y-t-D | |
| $/LBP | 1,514.25 | 1,514.25 | – | |
| €/LBP | 1,701.36 | 1,700.01 | 0.08% | |
| £/LBP | 1,895.53 | 1,895.08 | 0.02% | |
| NEER | 117.91 | 118.04 | -0.11% |
Closing Date: 04 July 2019